- Mark as New
- Bookmark
- Subscribe
- Mute
- Subscribe to RSS Feed
- Permalink
- Report Inappropriate Content
05-15-2015 04:24 AM
Hi,
I'm new to the forum, so apologies if this isn't the correct place to post this question, it seemed closest.
We've just started using the report fucntion of ServiceNow, and I've been asked to create some reports, then convert them to gauges so they can be added to the Site Leadership Teams (SLT) dashboards, so each site we're supporting.
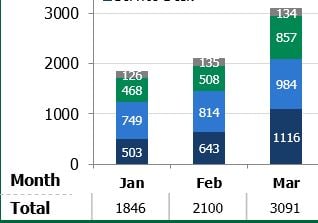
I'd like to create a bar chart, showing incident ticket volume per month for the last 6 months, for a single site, stacked by ticket priority (example below).

However when I create the report, using the below settings, I can't get it to display the ticket volumes per month. I'm sure it's something to do with the 'Group by' field, but I'm not sure which option to set, to get the report I need.
Type - Bar chart
Table - Incident
Group by -Created
Stacked - Priority
Aggregation - Count
Filter - Location - Site
Filter - Opened, Relative, After, 6, months, ago.

Additionally, I'd like to be able to create 1 report/gauge, for all sites, and the SLT's for each site use it, but have it so it automatically detects their site, and generates the report. Is this possible, maybe to use the location as a variable? Or do I have to create 1 report/gauge per site, and hardcode the location into the report?
Any help or advice on how to get the report I need would be greatly appreciated!
Thanks
Ben
Solved! Go to Solution.
- Labels:
-
Enterprise Release Management
- Mark as New
- Bookmark
- Subscribe
- Mute
- Subscribe to RSS Feed
- Permalink
- Report Inappropriate Content
05-15-2015 12:21 PM
Hi Ben,
Two issues -- one, I left out an important "gs.", and the other is, remove the "location = " from the filter, so it looks like this:
javascript:gs.getUser().getLocation();

- Mark as New
- Bookmark
- Subscribe
- Mute
- Subscribe to RSS Feed
- Permalink
- Report Inappropriate Content
05-15-2015 07:54 AM

- Mark as New
- Bookmark
- Subscribe
- Mute
- Subscribe to RSS Feed
- Permalink
- Report Inappropriate Content
05-15-2015 09:32 AM
For the location piece, I think you can do location = javascript:getUser().getLocation();
A couple other options for how you could provide them this information using Explore Analytics:
A single live timeline where you can switch between different locations and compare:
https://my.exploreanalytics.com/pub/view/1ee4f7c3f3cd4d468d8c36f28495676b
Here's an animated map:
https://my.exploreanalytics.com/pub/view/874b0743736d455cabd61caeffdd6e15
- Mark as New
- Bookmark
- Subscribe
- Mute
- Subscribe to RSS Feed
- Permalink
- Report Inappropriate Content
05-15-2015 11:36 AM
Hi,
Thanks for the reply.
Where do I put this java code? I tried in the filter condition field of the report, but it doesn't appear to work. If I select group by 'closed by' it's returning names of people I know aren't on my site, in theory, it should only be showing the names of people who closed tickets on my site. If I replace the java code, and enter my location as a string, the report generated is correct.

- Mark as New
- Bookmark
- Subscribe
- Mute
- Subscribe to RSS Feed
- Permalink
- Report Inappropriate Content
05-15-2015 12:21 PM