- Mark as New
- Bookmark
- Subscribe
- Mute
- Subscribe to RSS Feed
- Permalink
- Report Inappropriate Content
04-04-2022 04:57 AM
Hi,
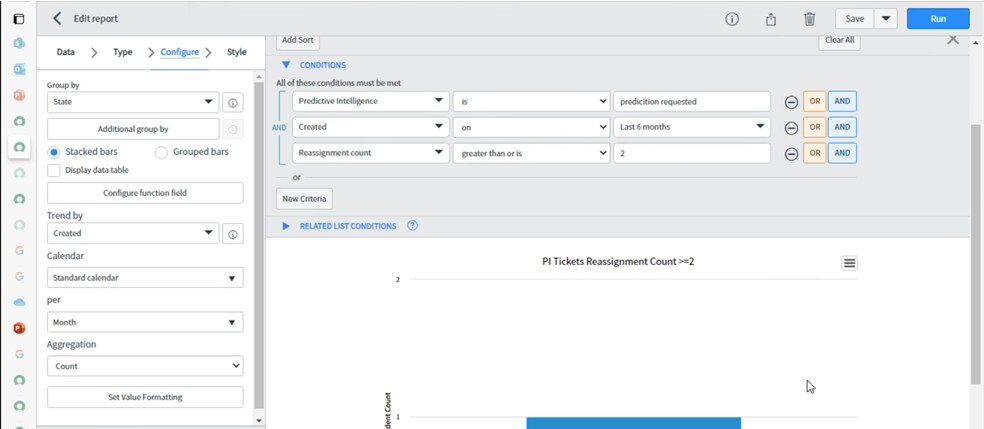
We need to display percentage of incidents on reports
Number of Incidents satisfying condition(reassignment count >= 2)/Total number of incidents in last 6 months
We are creating a report on Incident
Selected column graph as type and in configure-> Group by: State-> Trend by: Created ->Per Month ->Aggregate:Percentage
It is not giving expected result. Please guide how to achieve this.

Solved! Go to Solution.
- Mark as New
- Bookmark
- Subscribe
- Mute
- Subscribe to RSS Feed
- Permalink
- Report Inappropriate Content
04-04-2022 05:05 AM
Hi Renu,
Usually, if you just want to see the Percentage, you can just hover your cursor over the "Bars" in your report, you can see the percentage.
If you are using PA then:
In the attached video, a live example of a single score report is created based on the steps below:
step 1: An indicator source is created on the task table so that it can be used across multiple other indicators. The condition given is the 'task type' as an incident.
step 2: An automated indicator is created which filters all the breached incidents.
step 3: An automated indicator is created which gives the count of all the incidents.
step 4: Creation of data collection jobs for the automated indicators created above.
step 5: A formula indicator is created with below condition [[indicator created in step 2]] / [[indicator created in step 3]] * 100 After saving the formula indicator, we can also check the score by clicking on the 'Show Scorecard' related link.
step 6: Refer the formula indicator in a widget to display the same on a dashboard. Video URL is as below: https://www.youtube.com/watch?v=u1k0kplZlZY&list=PL2eqO0fbBIj8Ve_TYrRC9xsNUBUcizGvZ&index=8&t=0s
Thanks,
Sandeep
- Mark as New
- Bookmark
- Subscribe
- Mute
- Subscribe to RSS Feed
- Permalink
- Report Inappropriate Content
03-20-2024 11:37 PM
Any way we can achieve to get the percentage value via standard reporting and display it in the dashboard just like a single score without PA?
Thank you,