


Eric Weischedel

ServiceNow Employee
Options
- Subscribe to RSS Feed
- Mark as New
- Mark as Read
- Bookmark
- Subscribe
- Printer Friendly Page
- Report Inappropriate Content
01-04-2019
02:36 PM
Although unknown to many, the capability exists within SeviceNow to create a report based directly on data from an external spreadsheet file -- for example such as a spreadsheet created in the Microsoft Excel application. This blog post will describe the steps to create a report based on data from an excel spreadsheet, with a simple example. Much of this information is also covered, but in more detail in Knowledge Base Article KB0722420 - How to create a report based on data from an external Excel spreadsheet.
Creating a report using an external excel file
For this example we intend to create a report in ServiceNow that displays the counts of new clients for a furniture company based on the state the client is found in (geographical state). Perhaps also this data has already been captured and stored in a spreadsheet file used by the company.
The goal is to convert that data to an informative graphical based report in the companies ServiceNow instance.
Step 1: Format the Data Source (Spreadsheet)
The first action to take is to review (or create0 the spreadsheet file which will be used as the source data for the ServiceNow report. For spreadsheets that are intended to be directly imported for report data, the spreadsheet data should be in a straightforward format.
- The spreadsheet should be a series of rows of data, with each row representing perhaps one record in a "table" of related data.
- The top row of the spreadsheet should contain the column labels representing the data in the associated row.
For our example, we have the following simple spreadsheet data which we intend to use as the source for such a report.
Note that much more complex types of spreadsheets and data sources can be used for import into ServiceNow, but those will generally require the use of data mappings and import sets. See the Docs site Data Import Landing Page for more information regarding various methods to import more complex dataset into a ServiceNow instance.
For our example in this posting, however, the requirement is to make a quick report based on an existing spreadsheet.
Once a properly formatted spreadsheet is found, the next step is to perform the actual import into the instance.
Step 2: Import the Data into the Instance
- To begin this Step, login to the ServiceNow instance with an account having the necessary permissions to create new reports in the reporting system (i.e. admin or report_admin).
-
- Note also that in order for the necessary options to appear which will allow direct spreadsheet data import for a report, the Performance Analytics - Premium plugin must be installed on the instance.
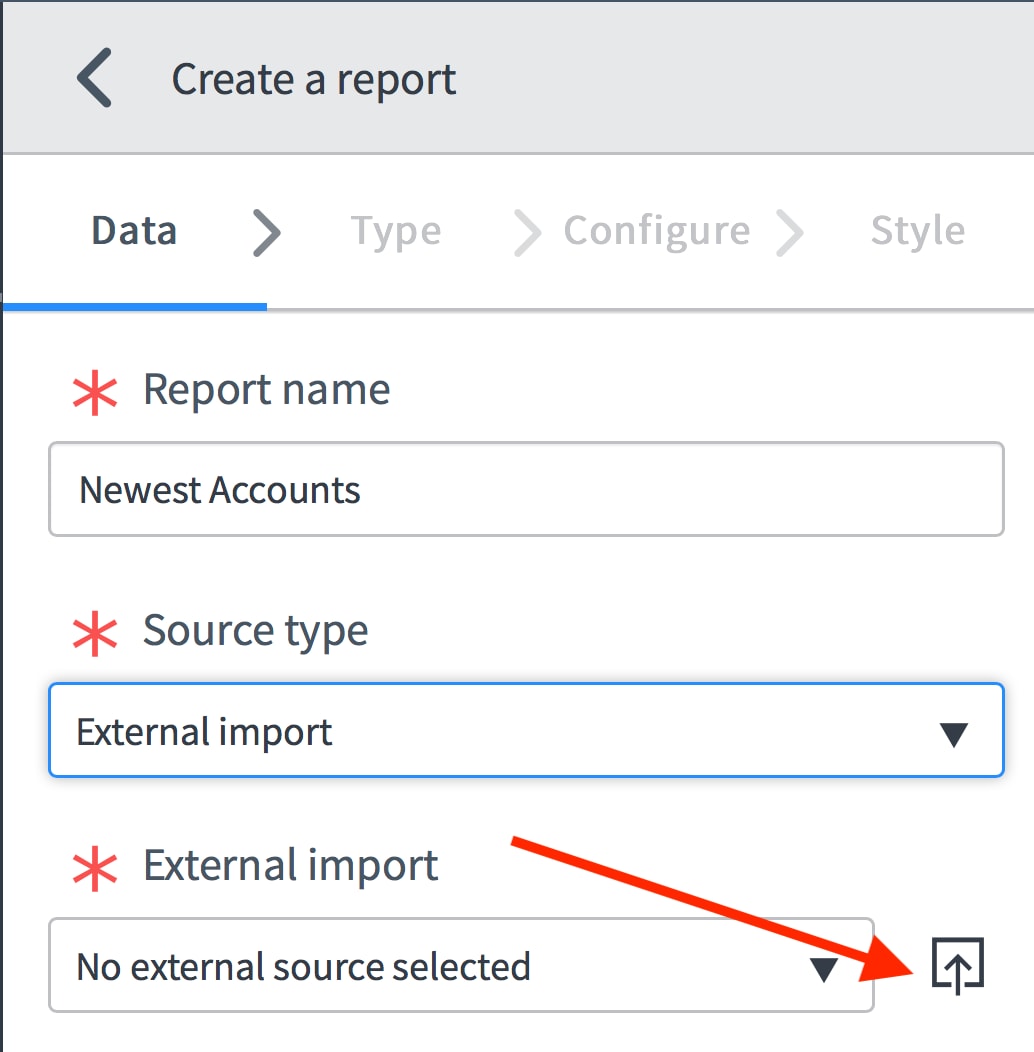
- Once logged in, browse to the location Reporting > Create New.
-
- Ensure you are using the new Report Designer interface as the direct spreadsheet import functionality is not available in the Classic UI.
- Give the report a descriptive name in the Report Name field.
- From the Source type pulldown menu, select External import.
- After selecting External import, click the Upload a file icon to the right of the External import field.
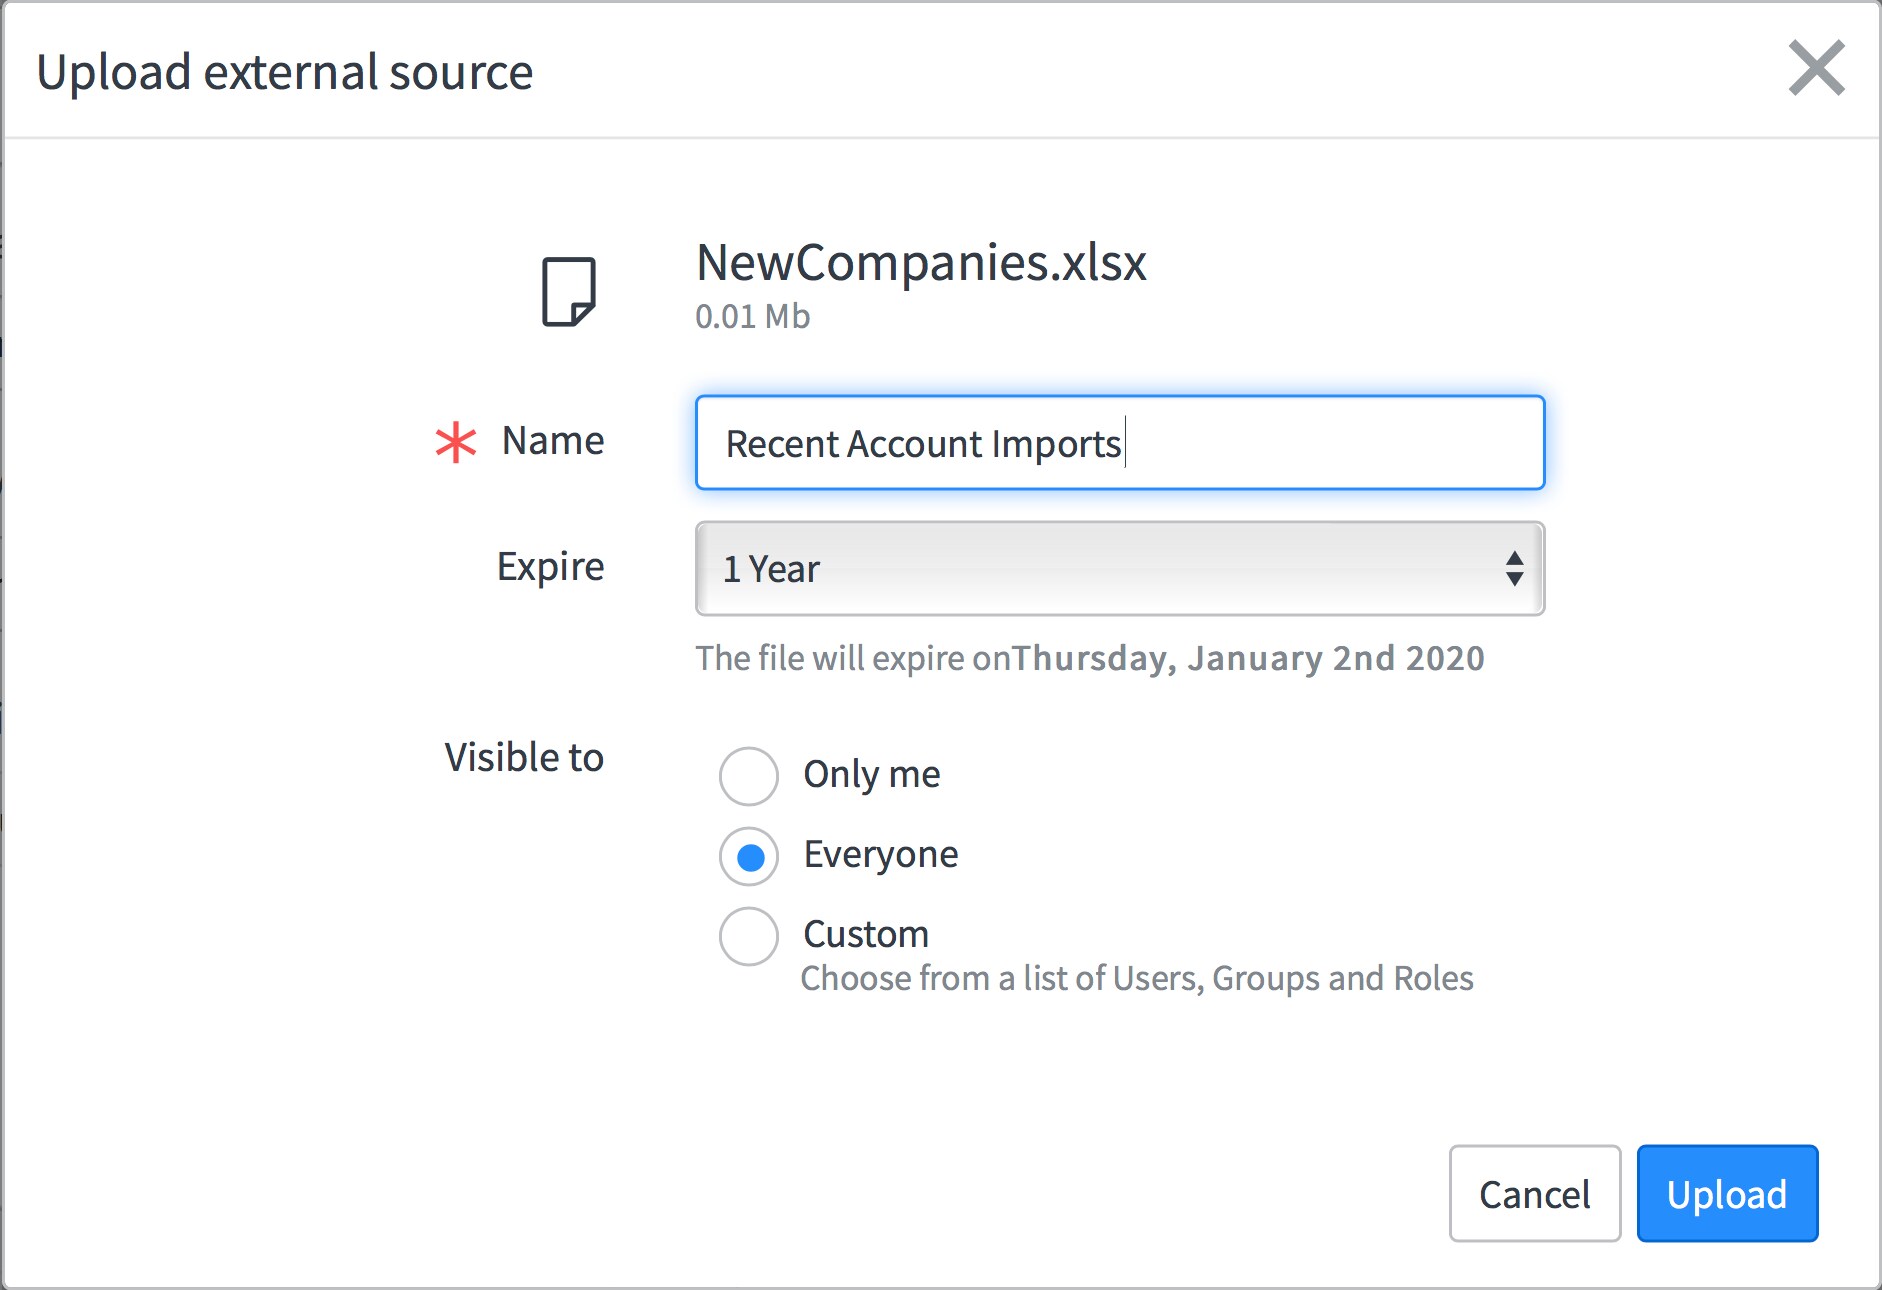
The Upload external source window will appear. The source data spreadsheet file can be dragged directly into the dragzone of the form, or alternatively, the Browse files button can be used to open a file browser to select the spreadsheet file.
Note that only files of .xlsx format and ending in a .xlsx extension can be selected and used as the data source.
After selecting the source spreadsheet file, the Edit external import window will appear. A name should be provided for the external data source and an Expiration option selected. The expiration option will be the selected time from the day on which the record is saved. After the expiration time is exceeded, the data source will be marked as expired and the reports will be deleted from the system. The expiration times can be selected from 1 week to 1 year.
Note that the data for an imported spreadsheet is static, so it will not automatically update if the data in the external spreadsheet is changed.
Lastly, the permissions for the external data source are set in the Visible to section. Ensure any users who should be able to review the completed report also has permissions to the data source.

After selecting all the options as needed, clicking the Upload button will load the external file and save the record. If any errors are returned, review the source file and ensure it follows the basic format recognized by the basic import engine. The import log can also be viewed to help resolve any issues that may have prevented the spreadsheet from importing properly. See the Doc site article Import Log for more information on these logs and how they might be accessed.
If the system was able to load the file successfully, a message will appear indicating the Import was successful. Click the Done button to close the import dialog window and return to the report record.
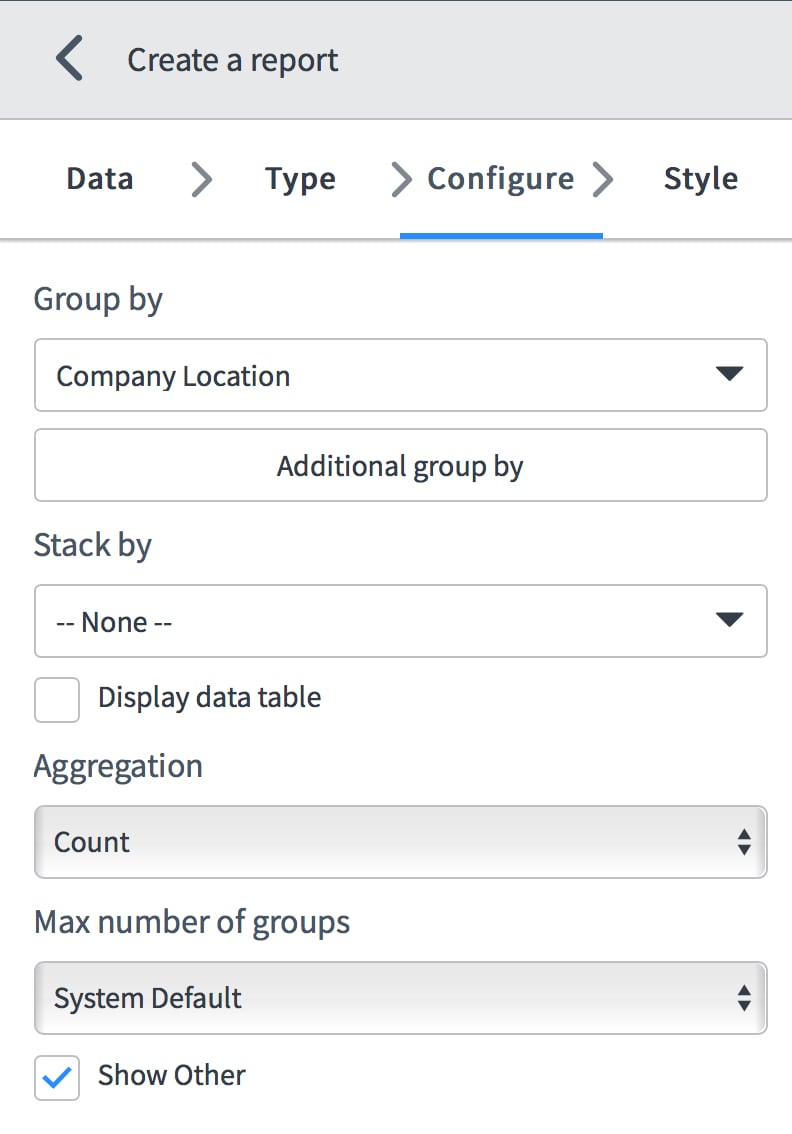
Step 3: Configure the Report
After the spreadsheet data source has been imported into the system, the last step is to complete configuration of the final report.
Group By
The Group by field will usually, by default, be set to the first column name it finds, thus you will probably want to modify this to group by the specific column you want to consider; in this example we will select the Company Location column.
Aggregation
It will also need to be determined what type aggregation should be used for the report (sum, average, count, etc). For this example, the default setting of Count is what we want. We will also leave the other option on the Configure tab to the default setting which should be adequate for our example.
If we want to modify any of the visual elements of the report, we can do this from the Style tab on the report designer interface. This includes settings for the color palette used, x and y axis labeling, legend display, etc.
Anytime during the process we can click the Run button to reload the current report without saving the report.
Once fully satisfied with the report, we can click the Save button which will Save the report and reload it.

There are some limitations associated with direct reporting from spreadsheet data as well as a few stipulations that are helpful to be aware of. Please see KB article KB0722420 - How to create a report based on data from an external Excel spreadsheet. In addition, ServiceNow Docs site article Create a report from an imported Microsoft Excel document details steps which can be used to create a report in ServiceNow from an external spreadsheet.
Labels:
- 6,379 Views
3 Comments
You must be a registered user to add a comment. If you've already registered, sign in. Otherwise, register and sign in.

