


Josh Cooper

ServiceNow Employee
Options
- Subscribe to RSS Feed
- Mark as New
- Mark as Read
- Bookmark
- Subscribe
- Printer Friendly Page
- Report Inappropriate Content
03-05-2019
09:46 AM
I recently was contacted by a customer who was having issues getting a large number of targets into ServiceNow Performance Analytics. He understood the process, but the difficulty he was experiencing is that he needed to put in thousands of targets, one for each possible breakdown element of a very large breakdown. The disconnected nature of the targets tables made it difficult to figure out the best way to do this. I'm not sure about best, but this is at least better than having to do it all manually through the UI. I elected to share it here as well, since I'm sure there are others of you with similar issues:
Note: You may need the admin role for some of these things, so if you don't have the appropriate access, reach out to your friendly neighborhood ServiceNow admin for help.
Further Note: It's a very very good idea to do this in a Dev environment. At least the importing part. That can make a very large mess if it goes wrong, although at least it'll be in the targets tables with minimal impact to anyone other than yourself.
Let's get started.
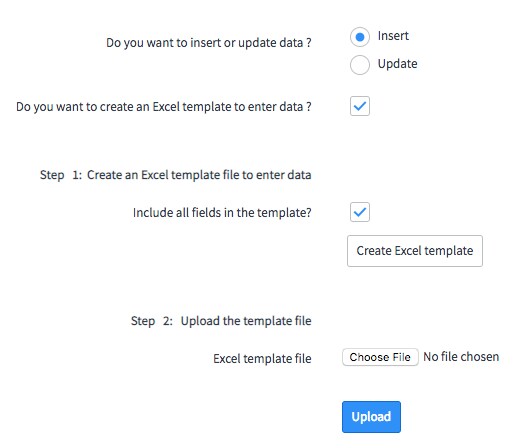
- Type pa_targets.list in the Filter Navigator on the top left, right click anywhere in the column header and pick Import.
- On that screen, pick “Insert”, make sure “Create an excel template” is checked, make sure “include all fields” is checked, and click “Create Excel Template”
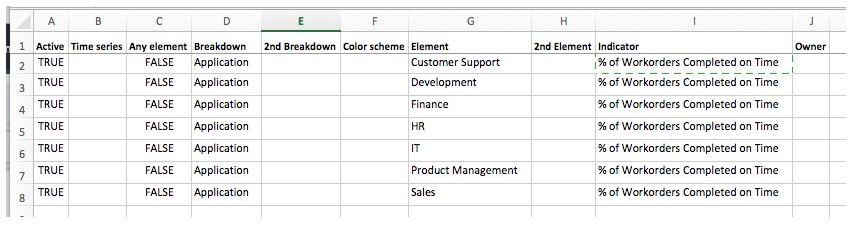
- Then, open the Excel template and it’ll look something like this:
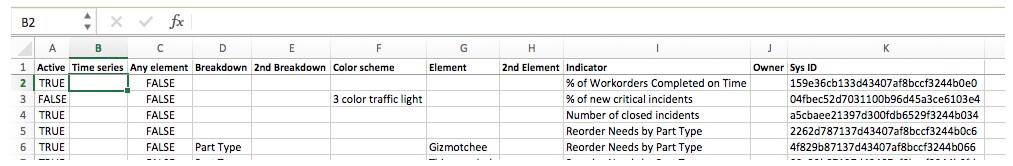
- Go back to the screen from step 2, by going back to pa_targets.list and picking import again (if it’s not still open!) – this time instead of “Insert”, pick “Update”, and Create the template. Open that and you should get something like this:
- Copy the row for the indicator you’re working on into the empty Insert template. You want to make sure you get Active, Any Element, Breakdown (because that’s what you’re doing in this case) and Indicator. Make sure you do NOT get sys_id or element. Well, element is okay, you’re just going to overwrite that anyway. Sys_id will confuse it, because it’s telling it which row to update. You want to copy and paste because it’s important that the name of the Breakdown and indicator match exactly. It’s also important that the Breakdown name is unique, when you’re doing it this way, because it’s a text lookup not a sys_id one, coming from an Excel import. If it’s not distinct, it’s absolutely worth your time to go temporarily change it to anything distinct, and then change it back. For some reason the temporary name that I tend to use is “Batman” or “Chicken” but you do you.
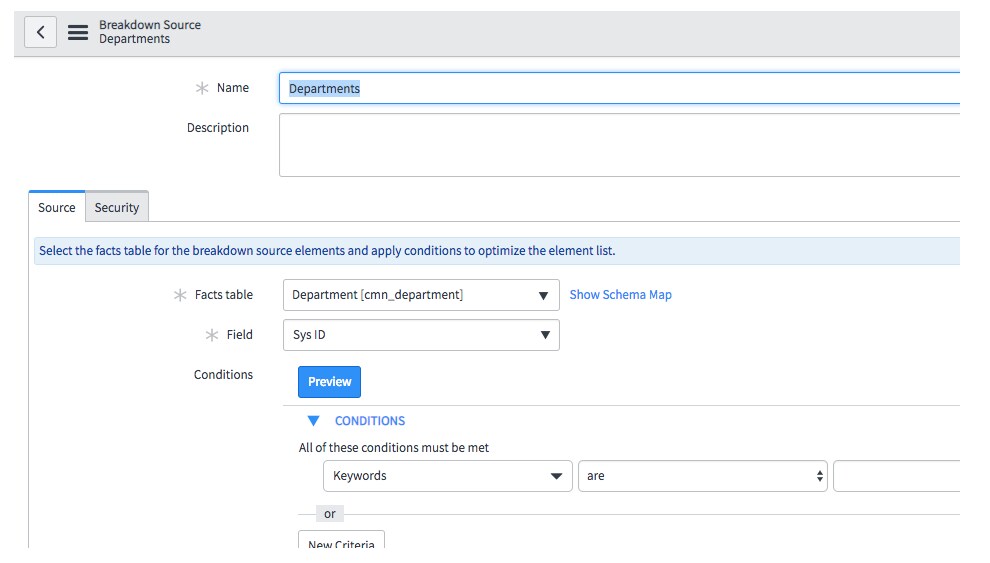
- Next step, go to the table that you’re getting your breakdown elements from, from the breakdown source. So if you really want to be sure, go back to ServiceNow and follow the links, click the breakdown, navigate up to breakdown source, get the table name directly from there, as well as any criteria. I’m using Departments as my closest example:
- Grab that table and open the list view, cmn_department.list, from the filter navigator, add any filters, then use the right click “Import” -> Update -> Create Excel Template to create another Excel dump. You can uncheck “include all fields”, you just want the names this time. You control that with the personalize gear… with the box unchecked it’ll only give you visible fields, if you check Include All, it… well, includes them all. You also might be able to use sys_id instead of name for a more exact match, but I’m not 100% sure.
- Now just copy the Name column over into your targets Insert template under Element:
- Now your Insert template should look something like this:
- Then, copy down Active, Any Element, Breakdown and Indicator, so you get this:
- Now, if you don’t still have it open, go back to pa_targets.list, right click the column headers, pick Import and Insert, then choose your file and import. It should create all those new rows for you.
- If you have DIFFERENT goals for each time series, then you can copy and paste the whole block in Excel and copy down the different time series values as well, so instead of 7 entries in the Excel insert, you’d have 7 for each different time series value, with a value of time series set. If you leave it blank, it should apply to all time series’.
- With that done, if everything looks good, go back to the pa_targets.list, Import, and pick Update, and Create Excel Template. That way it’ll give you the sys_id for each row.
- Navigate to pa_target_values.list in the Filter Navigator, right click the header to Import, Insert, Create Excel template.
- Open that, then copy and paste in the sys_ids from pa_targets as the Target column in pa_target_values Insert template.
- Then set your dates (to anything in the past) and the value that you want, and import.
You should be good to go!
Note: IF for some reason it won’t do an XML import with sys_ids as the reference (like we’re doing for Target), then use the Excel insert template as a data source and configure the data import that way. You can use the transform map functionality and “auto-map matching fields” and it should handle it for you. Transform map should handle the sys_id just fine.
Sub-note: If your data is already in Excel, it may be worth just setting up the whole thing as a more complex transform map – it may require a bit of light scripting because you’ll be inserting into two tables, but depending on the amount of data, it may be worth it. Plus, you’ll learn a thing, which I always think is cool.
It’s may be a lot of steps, but should be a lot quicker than doing it all manually!
Labels:
- 1,992 Views
1 Comment
You must be a registered user to add a comment. If you've already registered, sign in. Otherwise, register and sign in.

