


bianca_vaccarin

ServiceNow Employee
Options
- Subscribe to RSS Feed
- Mark as New
- Mark as Read
- Bookmark
- Subscribe
- Printer Friendly Page
- Report Inappropriate Content
06-22-2017
03:31 PM
Drilling down into reports within ServiceNow has always been one of my favorite uses of the reporting function. You can visualize tables, graphs, and pie charts all day long, but being able to see the details is what gives you clues into who, what, where and why. Every once in a while, be it a blip in the Wi-Fi or just user error, your drilldown comes up EMPTY, blank, or non-responsive. If you are experiencing blank drilldowns or white pages instead of beautiful lists, explore these three solutions.
Three scenarios that can cause blank pages when drilling down into a report
- "Other" value of report results in a blank page
- Drilling down into Speedometer and Dial types come up "empty"
- Report visualization returns a blank screen
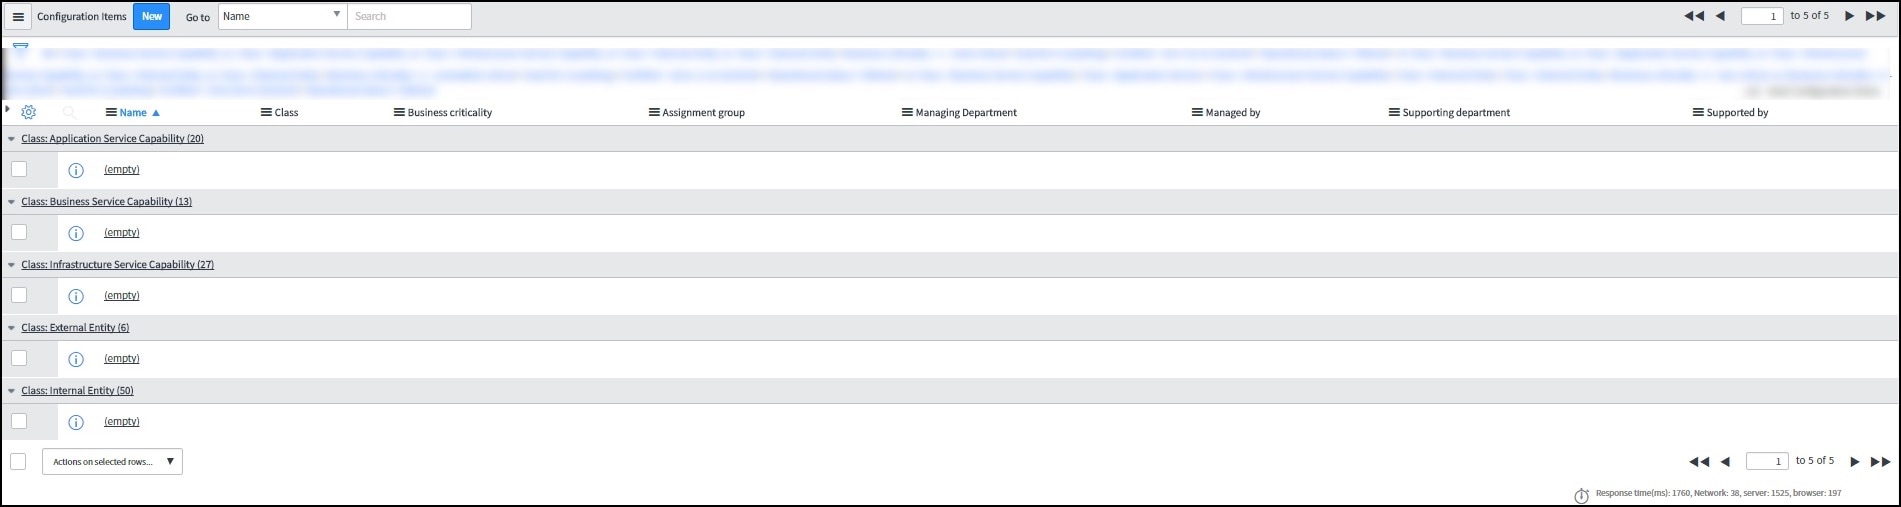
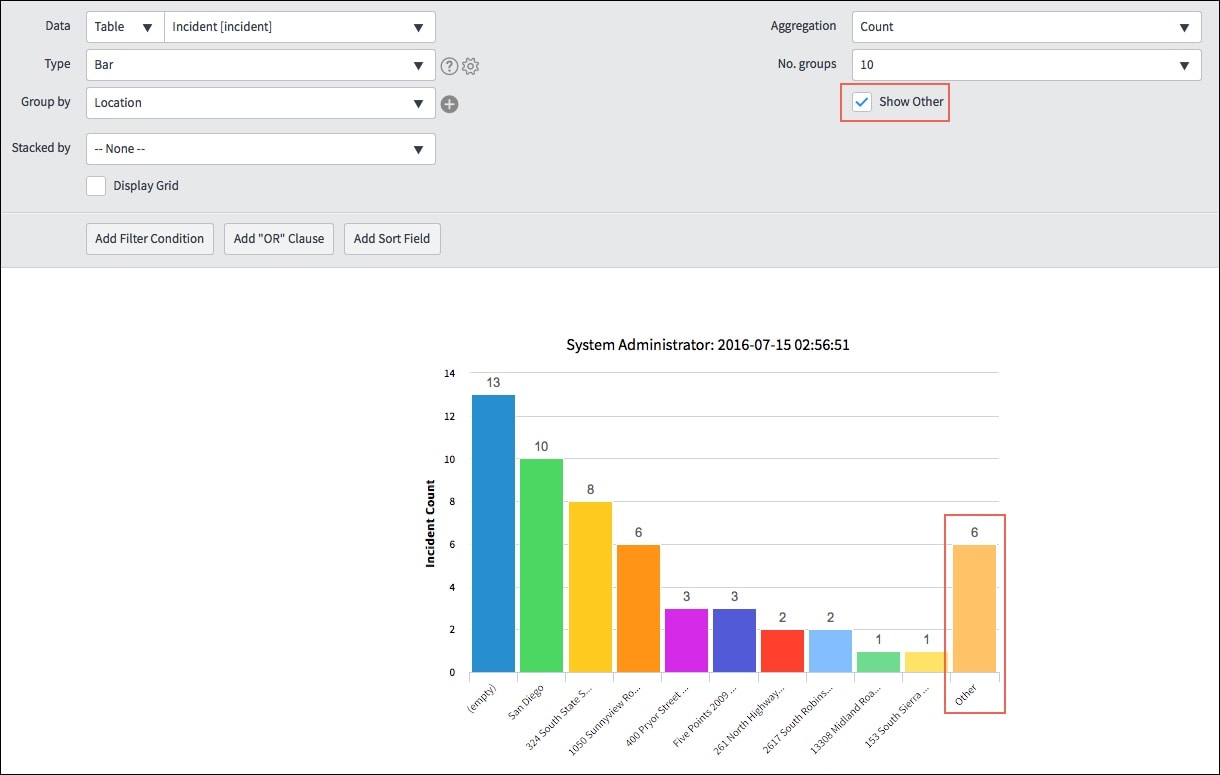
1. "Other" value of report results in a blank page
Imagine putting together a report, seeing the values, drilling down into a column only to see....NOTHING. If you have saved your changes to the report prior to drilling down into the data, you shouldn't have this problem. But for those on certain patches of Helsinki, you need to remember to save, save, save.
Now fixed in Jakarta, the others should no longer be ghosts in your table. (Name that movie reference!) See The "Other" section of a report does not display the correct data if the report is not saved (KB0596... for more details.
2. Drilling down into Speedometer and Dial charts come up "empty"
When looking at speedometer or dial report, expanding each of the categories may result in "empty" instead of records or values. If you experience "empty" drilldown reports, try refreshing. Refreshing the list by clicking on a data point in the drilldown list will show the correct list.
What are the three DIY basic troubleshooting steps? Turn it off and on again, clear your cache, and, if those don't work, refresh! See Drilldown to list is broken for Speedometer chart type (KB0622734) for more details.
3. Report visualization returns a blank screen
Report visualizations can help you make better business decisions. But when those visualizations and dashboards pull up blank, what can you infer? You need to start at the source to figure out what the issues is.
(WTF= where to find)
For instances on Istanbul or later, you will need to recreate the source report using the Report Designer instead of the Report Builder. See Blank screen after clicking on the chart body in the "Problem Triage and Fix SLA" dashboard (KB06232... for more details.
Blank pages pulling up when trying to dig deeper in a report doesn't necessarily mean your filters are wrong. Before you delete your fresh new report, check the source, try a refresh, or double check your version.
Labels:
2 Comments
You must be a registered user to add a comment. If you've already registered, sign in. Otherwise, register and sign in.

