- Mark as New
- Bookmark
- Subscribe
- Mute
- Subscribe to RSS Feed
- Permalink
- Report Inappropriate Content
07-13-2016 09:29 AM
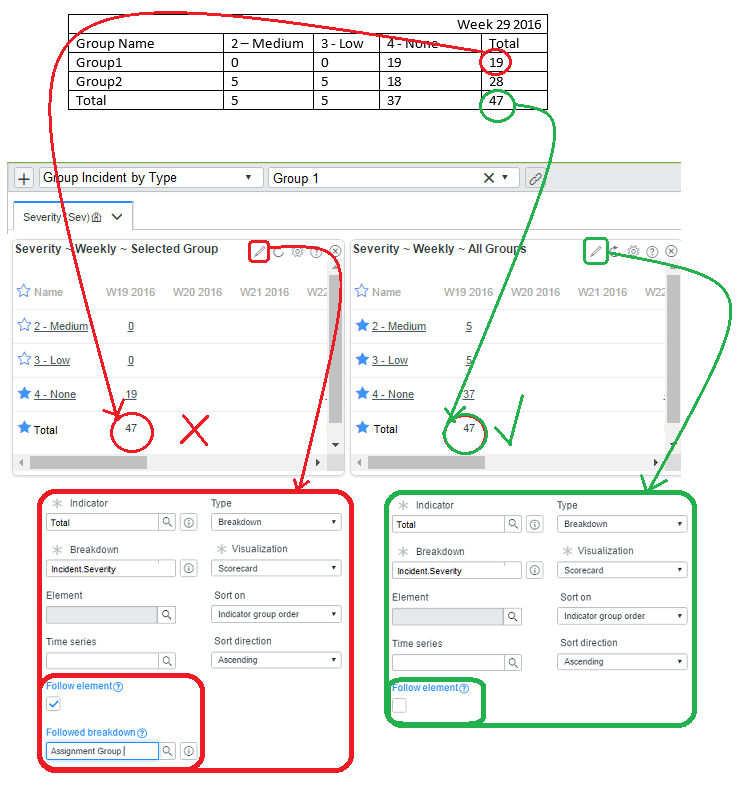
Is there any way that anyone knows to produce a breakdown dashboard similar to the below image?
I am using Widget Type = Breakdown; Visualization=Scorecard with Follow Element selected to Selected Group. Problem is that when 'Show Indicator' is set to true the totals are the same for both the selected AND All groups as I had expected the individual (selected) totals to match the selected totals as with the simplified dataset the follow element totals are displayed

Solved! Go to Solution.
- Labels:
-
Performance Analytics
- Mark as New
- Bookmark
- Subscribe
- Mute
- Subscribe to RSS Feed
- Permalink
- Report Inappropriate Content
07-27-2016 02:33 PM
On witch release are you working?
On Geneva and beyond it seems to work fine.
The totals are adjusted, when you select an element at dashboard level.
- Mark as New
- Bookmark
- Subscribe
- Mute
- Subscribe to RSS Feed
- Permalink
- Report Inappropriate Content
09-20-2016 03:21 AM
Yep - I noticed this has been corrected with Geneva Patch 5 though no-one informed me at the time I was informed this was working as designed and advised to open an enhancement request. Which I did and is still out there. Thanks for looking.