Create Report: Total Committed Story Points vs Completed Story Points
- Mark as New
- Bookmark
- Subscribe
- Mute
- Subscribe to RSS Feed
- Permalink
- Report Inappropriate Content
03-24-2021 09:00 AM
Good morning, I'm having some issues creating a report in ServiceNow on total committed story points vs completed. I'd like to do a "double spline" type graph with committed overlaid with completed.
I'm in the rm_story table and when I try to group by sprint I'm basically getting incorrect data stacked in one spot with months (for some reason) shown across the bottom.
I'd like to have each sprint along the x-axis and committed points along the y axis. This is probably such a basic question but I can't get the report to work.
Thanks in advance for any help and suggestions!

- Labels:
-
Reporting
- Mark as New
- Bookmark
- Subscribe
- Mute
- Subscribe to RSS Feed
- Permalink
- Report Inappropriate Content
03-24-2021 01:07 PM
Try putting the Sprints/ Stories at the bottom aka Group by - Also do one report for Committed, then save the report then go to report settings and select multidata layer report and create the other report but pick completed.
- Mark as New
- Bookmark
- Subscribe
- Mute
- Subscribe to RSS Feed
- Permalink
- Report Inappropriate Content
03-24-2021 01:16 PM
Hi Shawn,
Spline visualizations can only be used for time series, meaning your X axis has to be a time series like day, week, month etc. Am I correct in thinking you want the x axis to be the sprints, not a time series?
What you can do instead is to use a bar chart with two datasets, each data set summing the points of the sprint. One data set for all committed points and one for completed points.
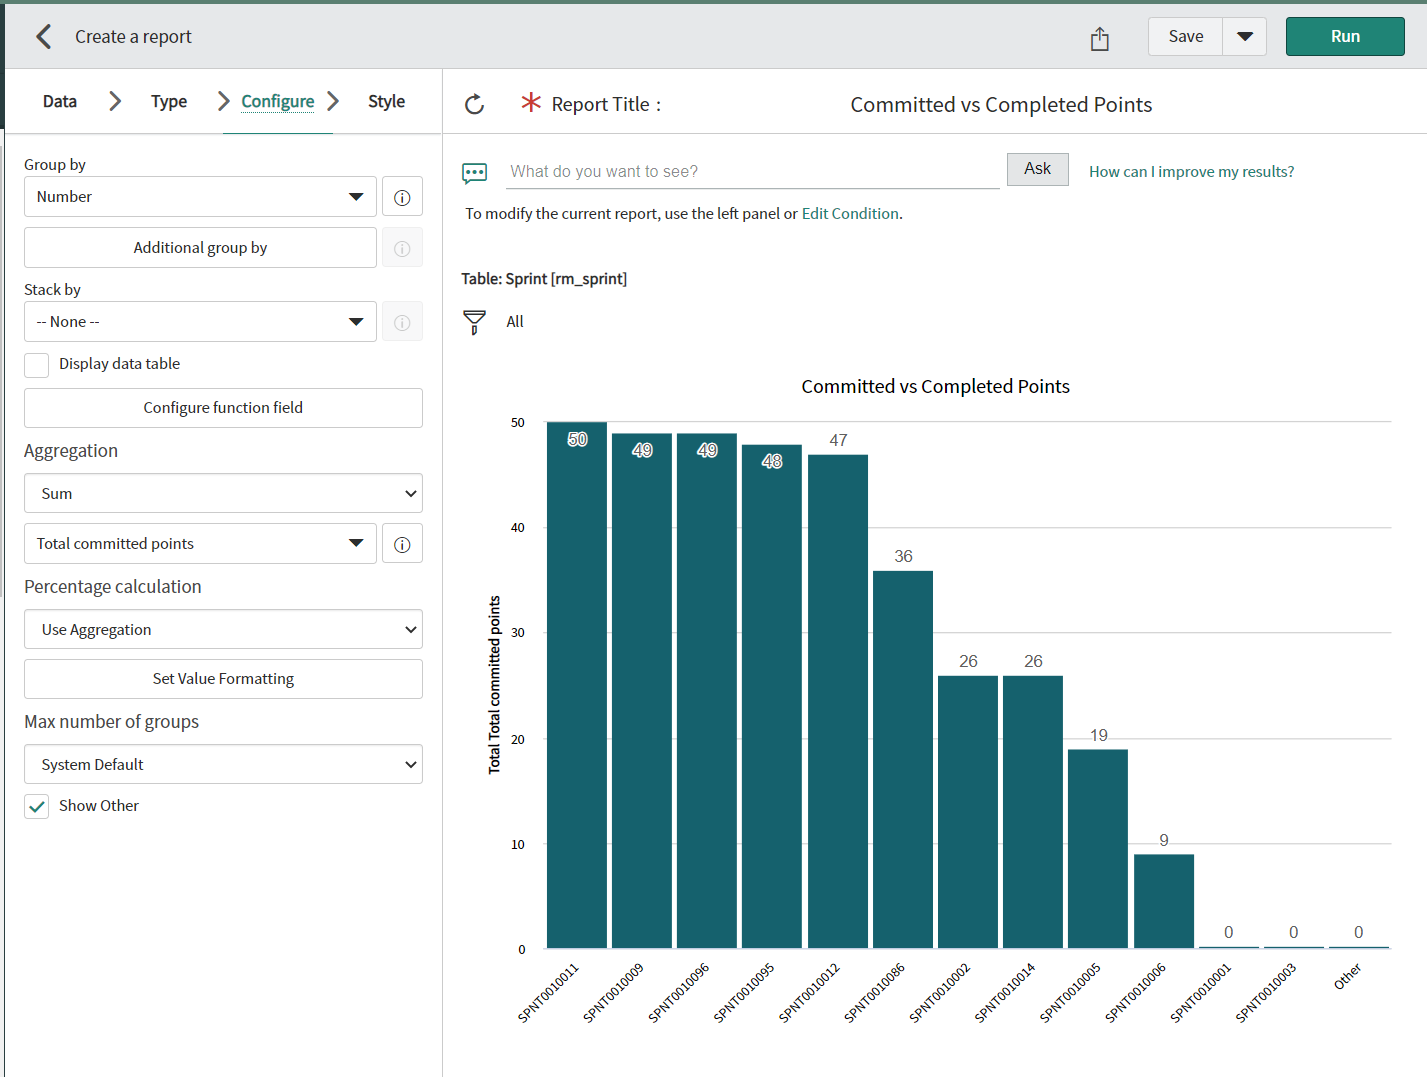
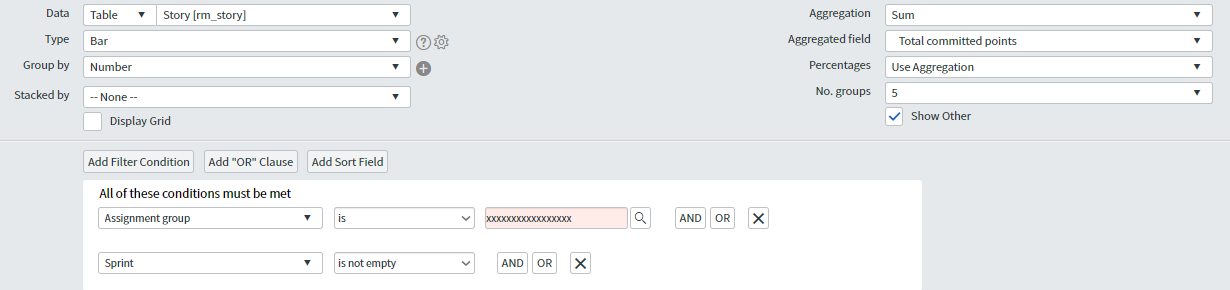
Start by creating a report for the SUM of total committed points, grouped by sprint number (or short description if you want):

Save the report and a new button will appear in the header called "report structure", click this and in the panel that opens, click "add dataset":

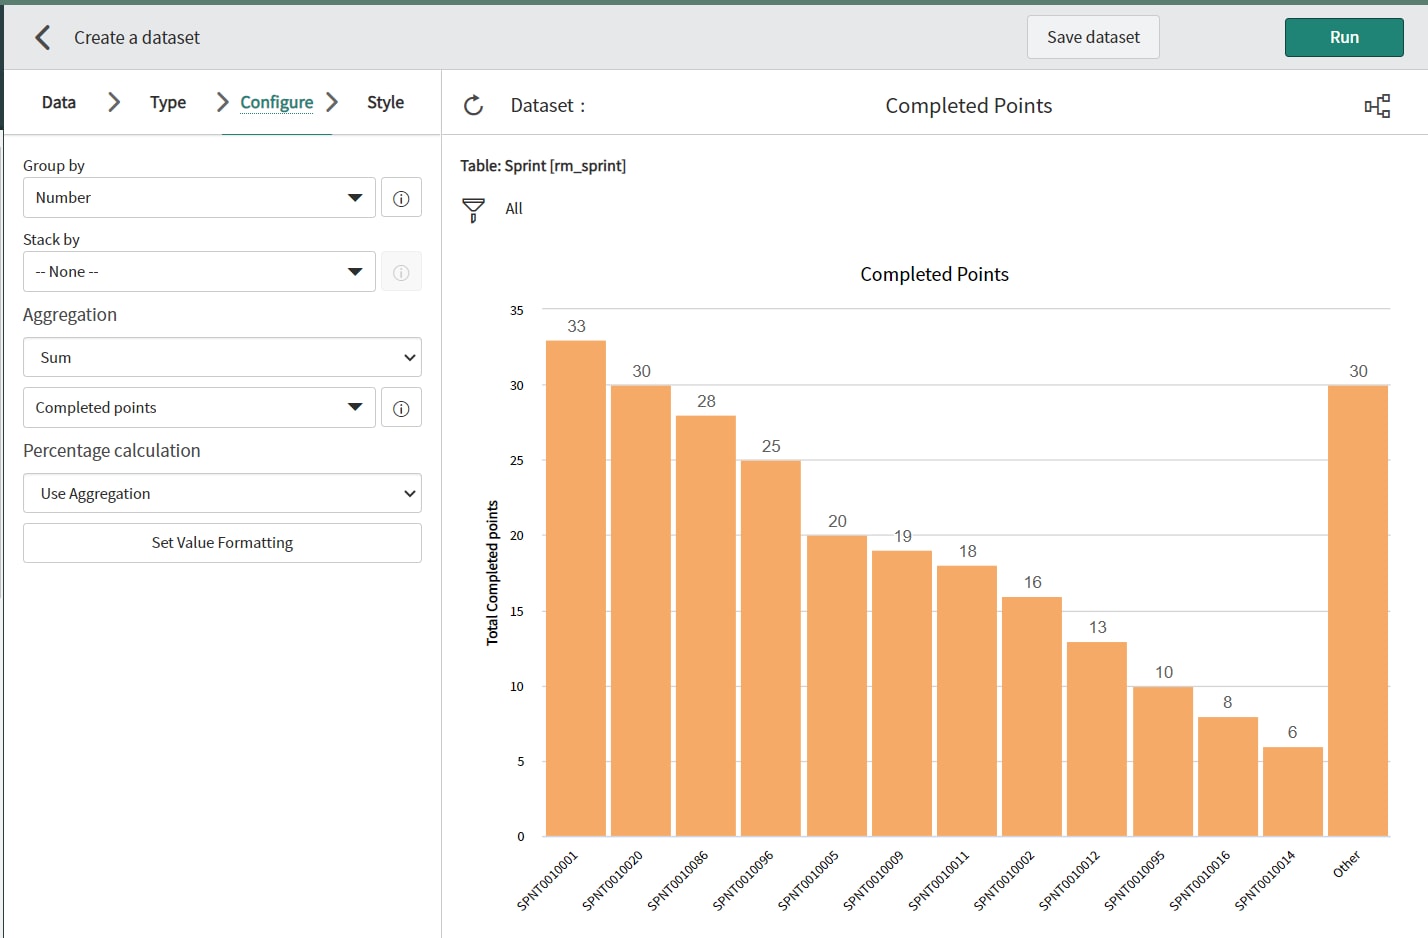
You'll be taken to the create report interface again. This time, create the same report but SUM the completed points:

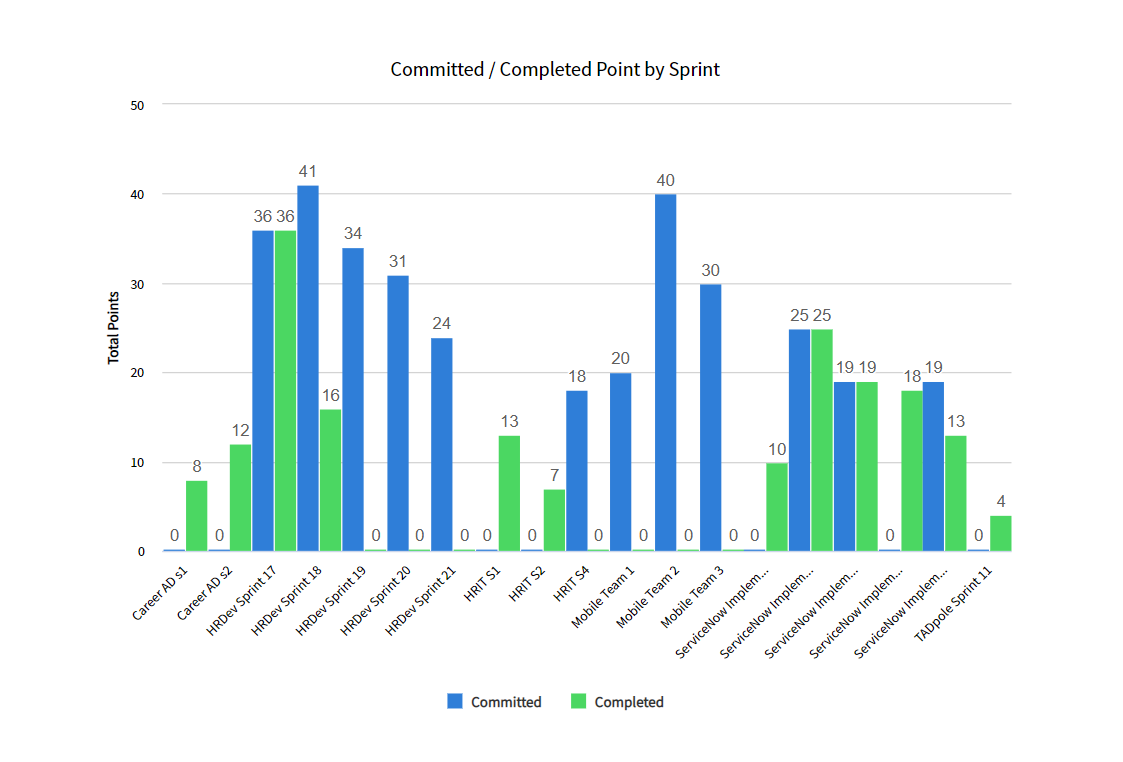
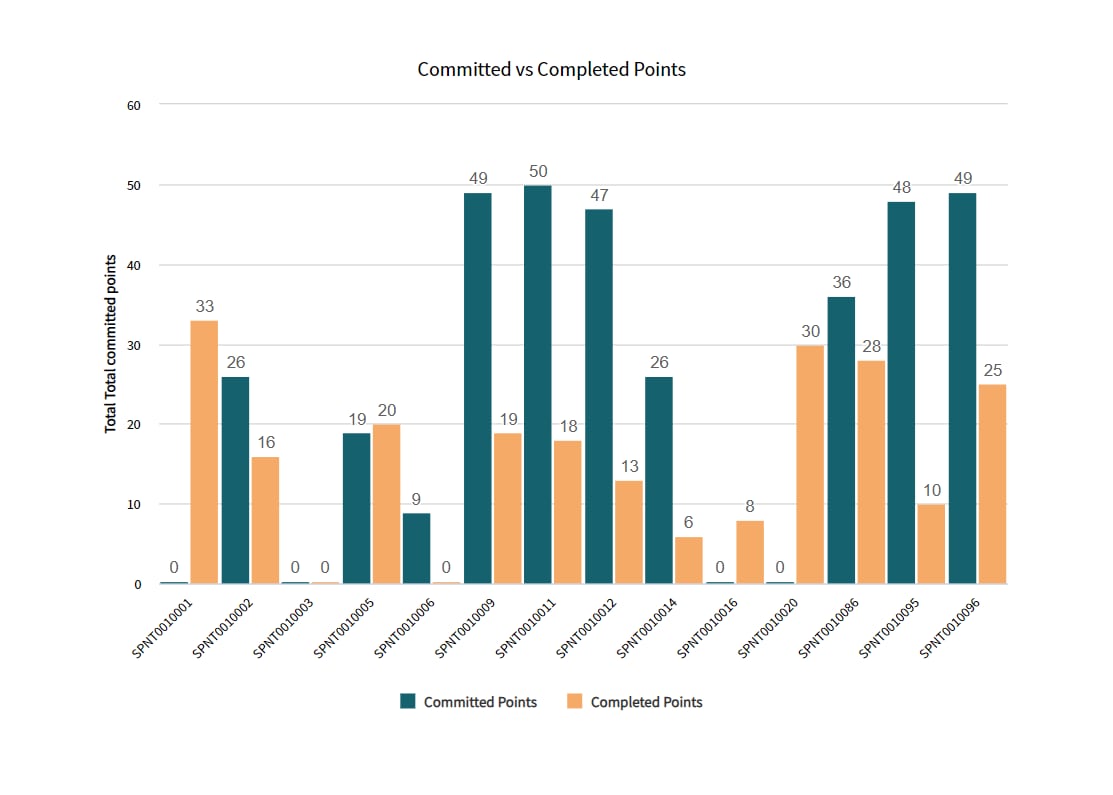
Save the dataset and you'll be taken back to the original report, which will now contain two bars for each sprint, one for the total points and one for the completed points:

Hope this helps!
- Mark as New
- Bookmark
- Subscribe
- Mute
- Subscribe to RSS Feed
- Permalink
- Report Inappropriate Content
03-26-2021 01:39 PM

- Mark as New
- Bookmark
- Subscribe
- Mute
- Subscribe to RSS Feed
- Permalink
- Report Inappropriate Content
03-26-2021 02:04 PM
Ahh, I based my example purely on the rm_sprint table since it has fields for both the values we wanted to report on. I think what you've set up in the picture is based on rm_story, and summed on the related sprint's field for "total committed points". That would mean the committed points in the sprint gets counted once for each story, essentially multiplied by the number of stories.
If you want to base the committed and completed points on the SUM of points in all stories related to the sprint, use the rm_story table and SUM on "points" and group by sprint. Then in the second dataset, do the same thing but add a filter for state = completed to get a sum of all completed stories points.
Or you could use my example and not use the rm_story table, but instead the rm_sprint. Then you can sum on the fields "total commited points" and "completed points" since they will only be counted once for each sprint.
Note that the two ways will produce different results, as the sprint field for "total committed points" does not contain the points of stories added to the sprint after it has changed to state "current". Read this post and the accepted answer for more information:
Hope this explains it!