- Mark as New
- Bookmark
- Subscribe
- Mute
- Subscribe to RSS Feed
- Permalink
- Report Inappropriate Content
05-22-2017 01:12 AM
Hi Team,
I need to assign to different colors to donut charts based on different values in report.
i am using incident_sla database view and color should be different and based on below Stage column values.
- Achieved (Green)
- In Progress (Yellow)
- Cancelled (Grey)
- Breached (Red)
Solved! Go to Solution.
- Labels:
-
Dashboard
-
Performance Analytics
-
Reporting
- Mark as New
- Bookmark
- Subscribe
- Mute
- Subscribe to RSS Feed
- Permalink
- Report Inappropriate Content
05-23-2017 01:21 AM
The actual value for In progress should be in_progress. Please correct this and it should work.
Thank You
Please Hit Like, Helpful or Correct depending on the impact of response
- Mark as New
- Bookmark
- Subscribe
- Mute
- Subscribe to RSS Feed
- Permalink
- Report Inappropriate Content
05-22-2017 01:20 AM
Reports --> Chart Colors should allow you to set this up
- Mark as New
- Bookmark
- Subscribe
- Mute
- Subscribe to RSS Feed
- Permalink
- Report Inappropriate Content
05-22-2017 01:25 AM
Hello Vicky,
Refer the below links may helpful to you.
http://wiki.servicenow.com/index.php?title=Configuring_Chart_Colors#gsc.tab=0
Define colors for report data categories
- Mark as New
- Bookmark
- Subscribe
- Mute
- Subscribe to RSS Feed
- Permalink
- Report Inappropriate Content
05-22-2017 01:25 AM
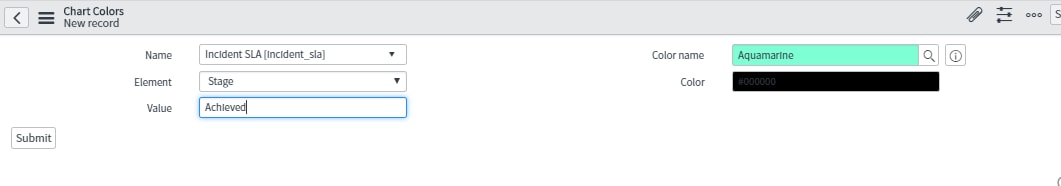
You need to use chart colors module under Reports
Create 4 different entries for chart colors, Select the required table and the Field on which should be having its values as colored. You can either select a system color or specify HTML color code

Thank You
Please Hit Like, Helpful or Correct depending on the impact of response
- Mark as New
- Bookmark
- Subscribe
- Mute
- Subscribe to RSS Feed
- Permalink
- Report Inappropriate Content
05-22-2017 02:49 AM
