How to report on number of Incidents active per day regardless of open date.
- Mark as New
- Bookmark
- Subscribe
- Mute
- Subscribe to RSS Feed
- Permalink
- Report Inappropriate Content
03-30-2021 02:15 PM
I haven't been able to find a thread on this one but some seem close.
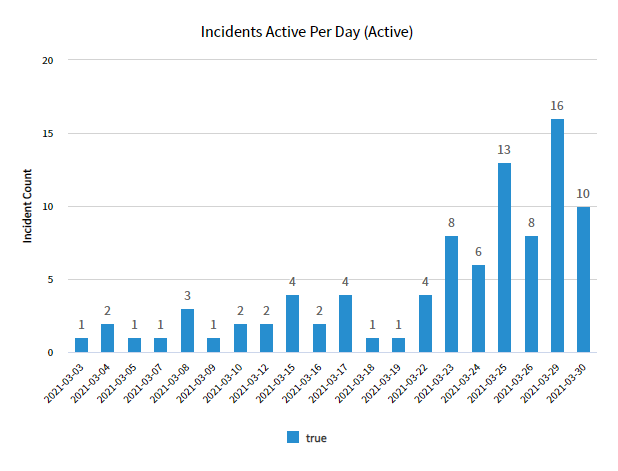
I want to create a report that shows the number of Active Incidents each day, regardless of when the incident was created.
I've tried various options but keep getting the number of Cases opened and Active by day.
For example, in the graph below if I drill down into 03/29 all of the incidents are active but they were also all opened on 03/29. I want to see all incidents Active on that day regardless of creation date.
I suspect the issue is the Trend By? I tried different options but cannot find what I a need.


The data returned shows Incidents active but opened on that day

- Labels:
-
Reporting
- Mark as New
- Bookmark
- Subscribe
- Mute
- Subscribe to RSS Feed
- Permalink
- Report Inappropriate Content
03-30-2021 03:21 PM
Hi Ralph,
This is the kind of use case that Performance Analytics was designed for. The reporting application is limited in its functionality and this is a bit beyond what it can do. With reporting, you can query a table for a data set, and then group that data set by a dimension. That dimension has to be in the data set. It could be the "opened at" field or the incident category, as long as it is a field in the table or a referenced table.
Logically for your use case, you'd want a query that runs once for each day, with the conditions:
- Opened on or before today
- Closed on or after today, or closed is empty
But in the report application, your query and filters will only run once, and return all the data at once. So you can't have that filter be dynamic per day. And you can't group by or trend by the concept of "a day", only by the actual fields - like "opened at".
What Performance Analytics will do is run a job for each calendar day in a period you specify, and execute the query once for each day. Each time the query is executed, the value of "today" will be set to the date of that day in the period. This query will return a daily value of incidents that were open on that day, save that as a score and then plot each score in a time series graph.
So in this case, you need PA. If you have ITSM Pro or Enterprise, you are entitled to active the PA Premium Plugin.
- Mark as New
- Bookmark
- Subscribe
- Mute
- Subscribe to RSS Feed
- Permalink
- Report Inappropriate Content
03-30-2021 04:29 PM
Thanks for the help.
I just put in a request for access to Performance Analytics.
- Mark as New
- Bookmark
- Subscribe
- Mute
- Subscribe to RSS Feed
- Permalink
- Report Inappropriate Content
06-08-2023 09:44 AM
This explanatory and illustrative reply is greatly appreciated.
- Mark as New
- Bookmark
- Subscribe
- Mute
- Subscribe to RSS Feed
- Permalink
- Report Inappropriate Content
06-09-2023 07:06 AM
If Performance Analytics is not an option, take a look at the incident_metric table
I would use a filter like so
