- Mark as New
- Bookmark
- Subscribe
- Mute
- Subscribe to RSS Feed
- Permalink
- Report Inappropriate Content
04-04-2018 09:03 AM
Hi,
I have been trying to show the report in PA which can display my assignment group in rows and months in a column. I could have used normal reporting trend but the result of these rows and column cannot be calculated without PA.
The result would be in % and formula I used is:
% of Successful Changes = [[Number of successful changes monthly]] / [[Number of closed changes monthly]] * 100
I have used formula indicator for this calculation. Number of successful changes monthly and Number of closed changes monthly are automated indicators I created. There is a monthly change job running for these indicators.
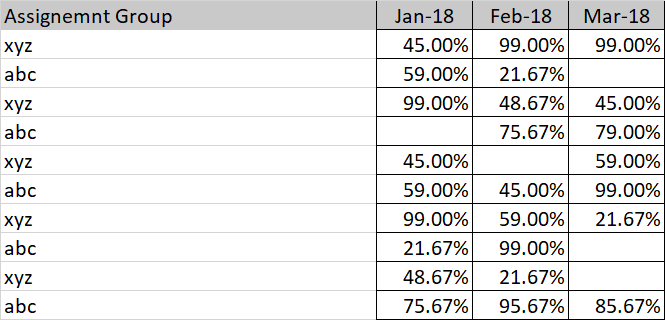
I want to see something like this:

This is what I am getting, just 1 month in column.
Any help would be appreciated. Thanks in advance.

Solved! Go to Solution.
- Labels:
-
Performance Analytics
- Mark as New
- Bookmark
- Subscribe
- Mute
- Subscribe to RSS Feed
- Permalink
- Report Inappropriate Content
04-04-2018 09:34 AM
If you edit your breakdown widget you will see a related list called column settings. One of the check box options is Multiple Scores.
Once you select that option you will be able to choose the number of periods as well as the steps. These settings will align to the Time Series setting for the widget. So in your case if you choose 3 periods you will see 3 months columns, one for each of the last 3 months.
- Mark as New
- Bookmark
- Subscribe
- Mute
- Subscribe to RSS Feed
- Permalink
- Report Inappropriate Content
04-04-2018 10:07 AM
Thanks for your quick reply... This is exactly what I want to see. Perfect!
~Su