- Mark as New
- Bookmark
- Subscribe
- Mute
- Subscribe to RSS Feed
- Permalink
- Report Inappropriate Content
12-27-2018 07:00 AM
I need a report or scorecard that will show the Monthly Average resolved time for resolved incidents for each analyst. I have found this formula, [[Summed duration of resolved incidents/ By month AVG]] / [[Number of resolved incidents / By month AVG]] / 24. I have the indicator built but I dont have the formula built for 'By month AVG". Can someone tell me how to build that and if the formula is correct.
Solved! Go to Solution.
- Labels:
-
Dashboard
-
Performance Analytics
-
Reporting
- Mark as New
- Bookmark
- Subscribe
- Mute
- Subscribe to RSS Feed
- Permalink
- Report Inappropriate Content
02-04-2019 11:13 PM
- Mark as New
- Bookmark
- Subscribe
- Mute
- Subscribe to RSS Feed
- Permalink
- Report Inappropriate Content
12-27-2018 07:19 AM
You can do this by pivot/muti-pivot chart in reports. Let me know if you need further assistance.
- Mark as New
- Bookmark
- Subscribe
- Mute
- Subscribe to RSS Feed
- Permalink
- Report Inappropriate Content
12-27-2018 07:57 AM
I do. I am new to reporting and performance analytics. I need step by step. Thanks
- Mark as New
- Bookmark
- Subscribe
- Mute
- Subscribe to RSS Feed
- Permalink
- Report Inappropriate Content
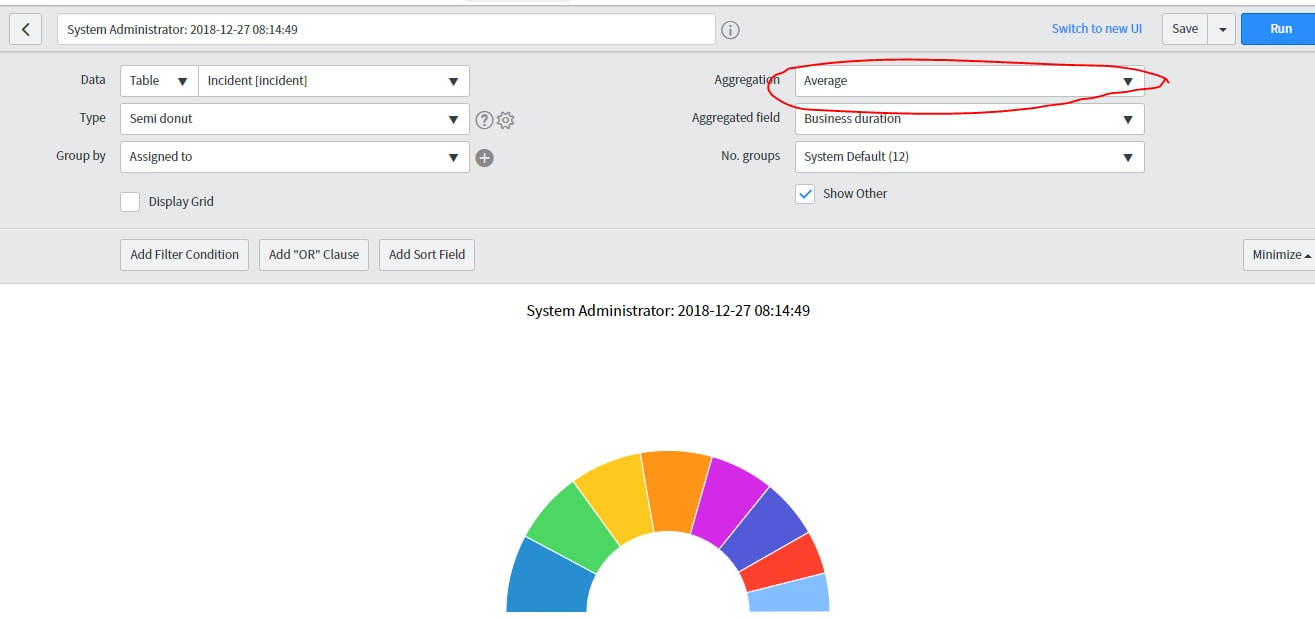
12-27-2018 08:19 AM
Refer this screenshot:

In this you can see, its showing aggregate of business duration/assigned to. So, in this way you can achieve this requirement. There are also other types of graph available. Also, you can add filter condition according to your need like created on this month and state is one of closed or resolved.
- Mark as New
- Bookmark
- Subscribe
- Mute
- Subscribe to RSS Feed
- Permalink
- Report Inappropriate Content
12-27-2018 08:18 AM
By Month Avg in the example you showed is just a time series added to an existing indicator (although using by Month Sum + would probably give more accurate results for this). The challenge you may run into is trying to breakdown by Assigned To, because if you make your breakdown source just the User table, it'll probably be too many Breakdown Elements or not useful. You may want to make a copy of that and call the breakdown "Incident Assignee" where you can set your breakdown source to "User table" with a related list condition "related to 1 or more record on Incident -> Assigned To". That way it skips anyone in the user table who hasn't been assigned an incident.
If you want to go pure reporting, try a regular bar graph like this and see if it gets you close:

It should work fine, but my data is weird, which is why you see crazy numbers here. The drawback to the reporting approach is that it can only show you present state of the data. For example, if I close a ticket, but later the assigned to is changed, then it will credit whoever the current assigned to is. Performance Analytics on the other hand will keep the score in the table at the time it's run - so even if it changes later, it will still be credited to the person who it was assigned to on that specific day.
Hopefully this helps!