- Mark as New
- Bookmark
- Subscribe
- Mute
- Subscribe to RSS Feed
- Permalink
- Report Inappropriate Content
04-14-2020 01:25 PM
Guys i really need this function, i want to run a report on Service now based on CSAT responses for this year. I always need to export it to excel in order to complete this ? Can you please help me how to do that on Service Now?
I need the table to be the same as the screenshot below, the trends should be Monthly based on the responses from 1 to 5

Solved! Go to Solution.
- Labels:
-
Reporting
- Mark as New
- Bookmark
- Subscribe
- Mute
- Subscribe to RSS Feed
- Permalink
- Report Inappropriate Content
04-16-2020 01:49 AM
Hi Rohan,
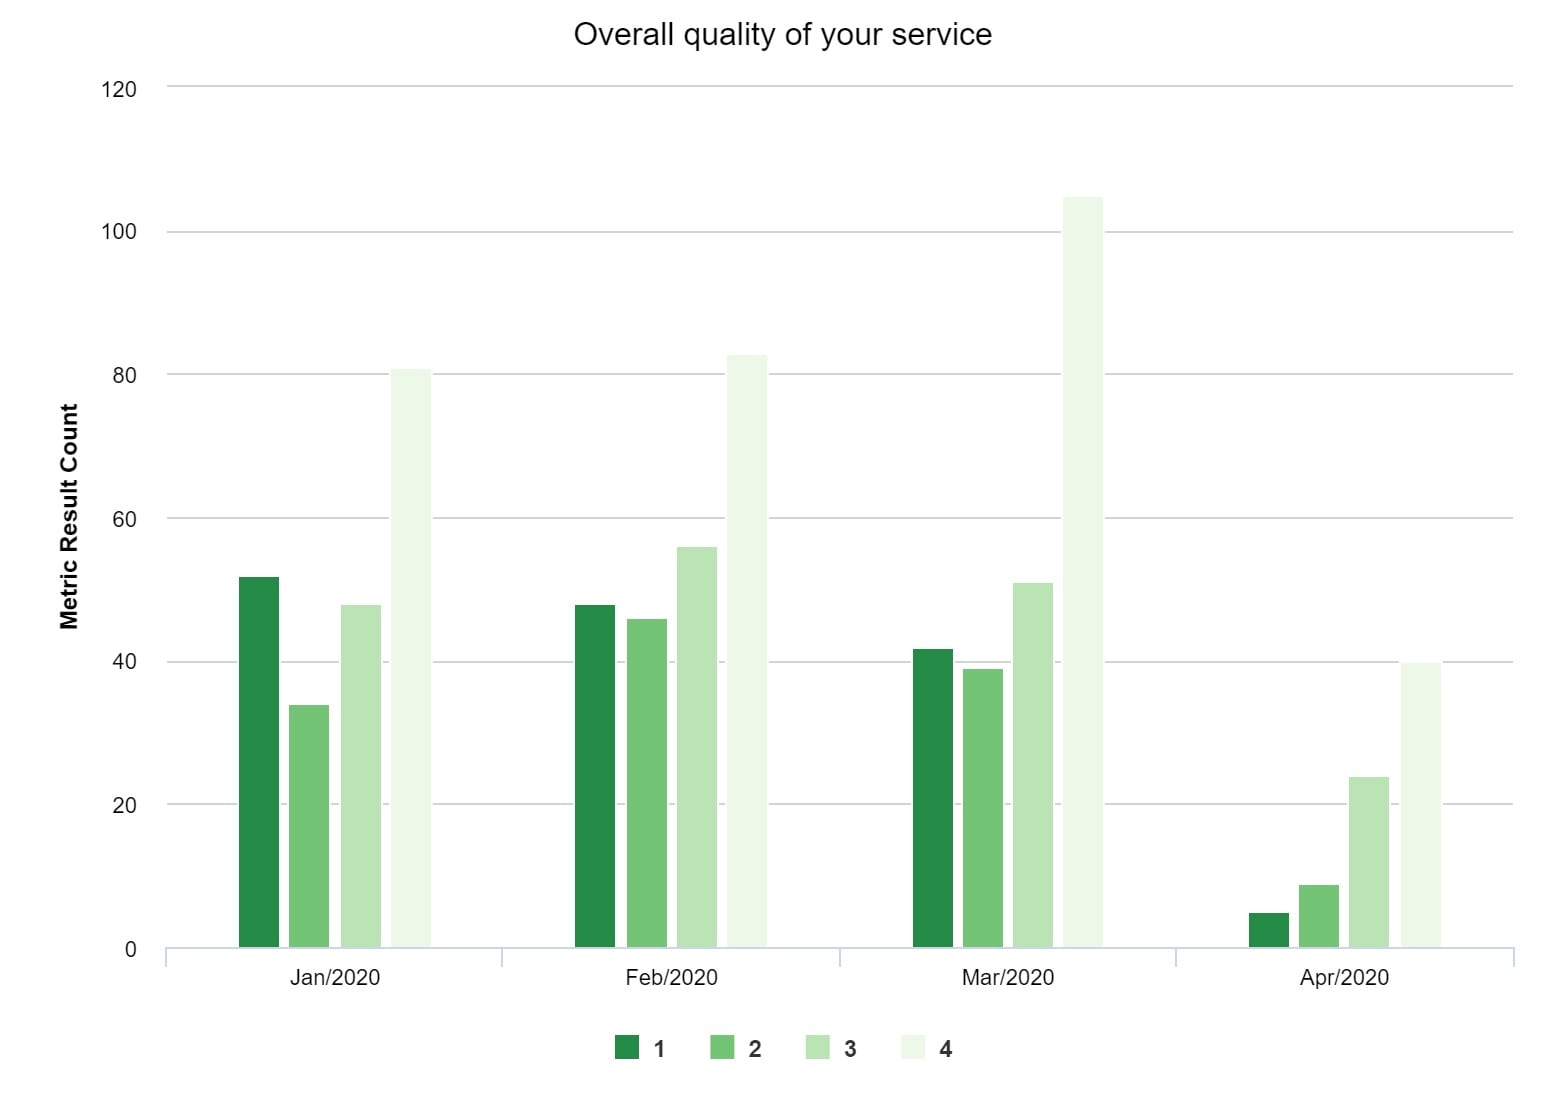
You are probably trying to achieve something like this:

To get this, navigate to:
- Table: Metric Result
- Type: Column
- Group by: Scaled value
- Trend by: Taken on
- Per: Month
Then, apply these Conditions:
- Metric.Category IS [whatever your CSAT is called]
- Metric IS [whatever question you're analysing]
- Instance.State IS Complete
This will then illustrate your responses, as per my example.
Please mark if this answer is helpful.
Thanks,
D 🙂
- Mark as New
- Bookmark
- Subscribe
- Mute
- Subscribe to RSS Feed
- Permalink
- Report Inappropriate Content
04-15-2020 06:42 PM
Hi Rohan,
Please follow below steps to achieve this,
1} Goto application navigator => Reports
2} Give the name for the report, Select Source type as table if you are going to do the reporting on existing serrvicenow tables or select Datasource if you are getting data from external datasource like mysql or select external import if you want to import the external file CSV, Excel

3} Click on Next, select type of visual as Bar chart

4} Click on Next
Here in group by select the date field in your table which is at X-axis in your Screenshot
In Stack by Select option Group bars and select the field which is having response value 1 to 5 in your screenshot

5} Click on Next
if you want to give some style effect like different color, chart color, title and all.
6} Run the report
7} Save the report
8} if you want to share this report , Click on share option

you can find several option like export to pdf and all.
Hope this will help you,
If you face any issue then let me know.
Please mark reply as Correct/Helpful, if applicable. Thanks!
Regards,
Tushar
- Mark as New
- Bookmark
- Subscribe
- Mute
- Subscribe to RSS Feed
- Permalink
- Report Inappropriate Content
04-16-2020 01:49 AM
Hi Rohan,
You are probably trying to achieve something like this:
To get this, navigate to:
- Table: Metric Result
- Type: Column
- Group by: Scaled value
- Trend by: Taken on
- Per: Month
Then, apply these Conditions:
- Metric.Category IS [whatever your CSAT is called]
- Metric IS [whatever question you're analysing]
- Instance.State IS Complete
This will then illustrate your responses, as per my example.
Please mark if this answer is helpful.
Thanks,
D 🙂
- Mark as New
- Bookmark
- Subscribe
- Mute
- Subscribe to RSS Feed
- Permalink
- Report Inappropriate Content
04-19-2020 06:31 AM
Thank you both ! I have been able to achieve this by combining both answers ! Thanks a lot guys ! 😄
- Mark as New
- Bookmark
- Subscribe
- Mute
- Subscribe to RSS Feed
- Permalink
- Report Inappropriate Content
08-31-2020 04:50 AM
We have an existing article that might help you, in case you are not aware. You can find it here!KB0836062