time series report on peak incident periods
- Mark as New
- Bookmark
- Subscribe
- Mute
- Subscribe to RSS Feed
- Permalink
- Report Inappropriate Content
11-07-2016 08:21 AM
I need to create a report based on Peak Periods (actually just showing us trend of Hour for created field value on Incident table)
The problem: reports do not show zero values, so we skew the graph slightly by not plotting these data points
eg. No calls occurred at 4am, so there axis shows 1,2,3,5,6, etc
One possible solution could be to utilise the PA widgets as these are really nice and DO show zero values eg: "Number of new Incidents"
However, I cannot see how to create a new time series and/or Frequency of "Hourly" and collect data based on this unit
Something multilevel pivot seems to have addressed from H, so clearly a gap but when we need a visual representation - we need the scale to be consistent so it should show 24 hours on the axis regardless!
Please don't make me export to Excel!!!
- Labels:
-
Performance Analytics
- Mark as New
- Bookmark
- Subscribe
- Mute
- Subscribe to RSS Feed
- Permalink
- Report Inappropriate Content
11-07-2016 11:58 PM
Any ideas? I'm going to have to export in the interests of brevity but would prefer to push it back in the tool
- Mark as New
- Bookmark
- Subscribe
- Mute
- Subscribe to RSS Feed
- Permalink
- Report Inappropriate Content
11-11-2016 10:13 AM
Hi mrswann,
To view a trend that shows when tickets are registered during the day, an intraday or hourly collection of scores is not necessary! A daily collection can be used for the 'Number of new incident' indicator combined with an 'Hour of Day' breakdown.
Now there is not yet a list of the 24 hours so we have to create one. In Performance Analytics that is stored in a bucket group (the same concept as report ranges within reporting). In a bucket group you manually create buckets. A bucket has a name, a numeric start value (that is a 'equal or greater than' value) and a numeric end value ( that is 'less than' value).
Most likely you already have that bucket group 'Hour of Day', it comes out of box:

Now we have the list that holds all the breakdown elements that we want to use. Next step is to create the breakdown source. In this case your facts table for the breakdown source is the Bucket table (pa_buckets).
Once again, check if you do not already have it. It should look like:

Next step would be to create a breakdown and a breakdown mapping to the incident table. But we just created this 'hour of day' list of breakdown elements, so there is no column in the incident table that holds these values that we want to use as the group by of the number of new incidents. That is where we gonna create a Performance Analytics script. A Performance Analytics script is only used during scores collection! Think of it as if it creates a virtual column for all the incident records that fit the conditions of an indicator and for each record it also populates that virtual column with a value. Now we do have that 'group by' (breakdown) attribute that we need.
Because a bucket has a numeric start and end value, the outcome of the script should be numeric.
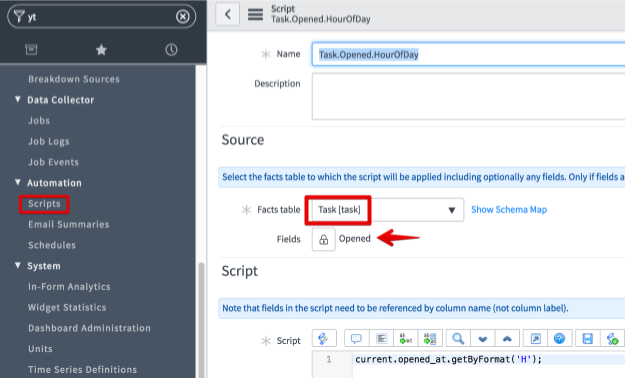
Once again you probably already have the script that we need, it looks like:

Notice that the script is based on the Task table. You could change or copy the script to work of the incident table, but that is not necessary.
Make sure that you always list the fields that will be used in the script in the source section. It will generate collection errors if a field is not listed!
Next step is that we use the script in the breakdown mapping. Once more you probably already have it and it looks like:
-the breakdown:

-the mapping:

(check the Scripted checkbox so the Script fields becomes available)
And finally, relate the breakdown to the 'number of new incidents' indicator.
Hope this helps.
Cheers, Pieter
- Mark as New
- Bookmark
- Subscribe
- Mute
- Subscribe to RSS Feed
- Permalink
- Report Inappropriate Content
11-14-2016 06:41 AM
Peter, that guidance looks awesome... I will need to circle back to this thread now I am mid-upgrade but this is on my backlog and I really appreciate you taking the time to comment, I can see how that will work but haven't put it into action.
- Mark as New
- Bookmark
- Subscribe
- Mute
- Subscribe to RSS Feed
- Permalink
- Report Inappropriate Content
02-07-2019 07:46 AM
These are great directions to set up by breakdown by hour of day. I only have one problem so far, when I ran the collection, the values were all offset by 5 hours. I presume this is because we are running in EST and the script bucketed the results by GMT. I attempted to get around this by adding -5 to the SLA and the times are now in the correct buckets, but I am missing data for the last 5 hours of each day. How would I solve this time discrepancy.