Instance Performance Issue due to Schedule Jobs
- Mark as New
- Bookmark
- Subscribe
- Mute
- Subscribe to RSS Feed
- Permalink
- Report Inappropriate Content
11-07-2019 12:42 AM
Dear ServiceNow Folks,
Greetings.
I would like to get your advise and suggestion on one of the Platform performance issues that needs to be fixed .
We have close to 63000 Schedule Jobs in trigger list currently in our environment . We would like to delete the jobs that are not useful and impact performance of our environment.
We have almost to 350 jobs in ready state whose Run count is above 180000 milli seconds(3 Minutes).
I would need some help on the categorizing on jobs based upon it importance and which are system generated which
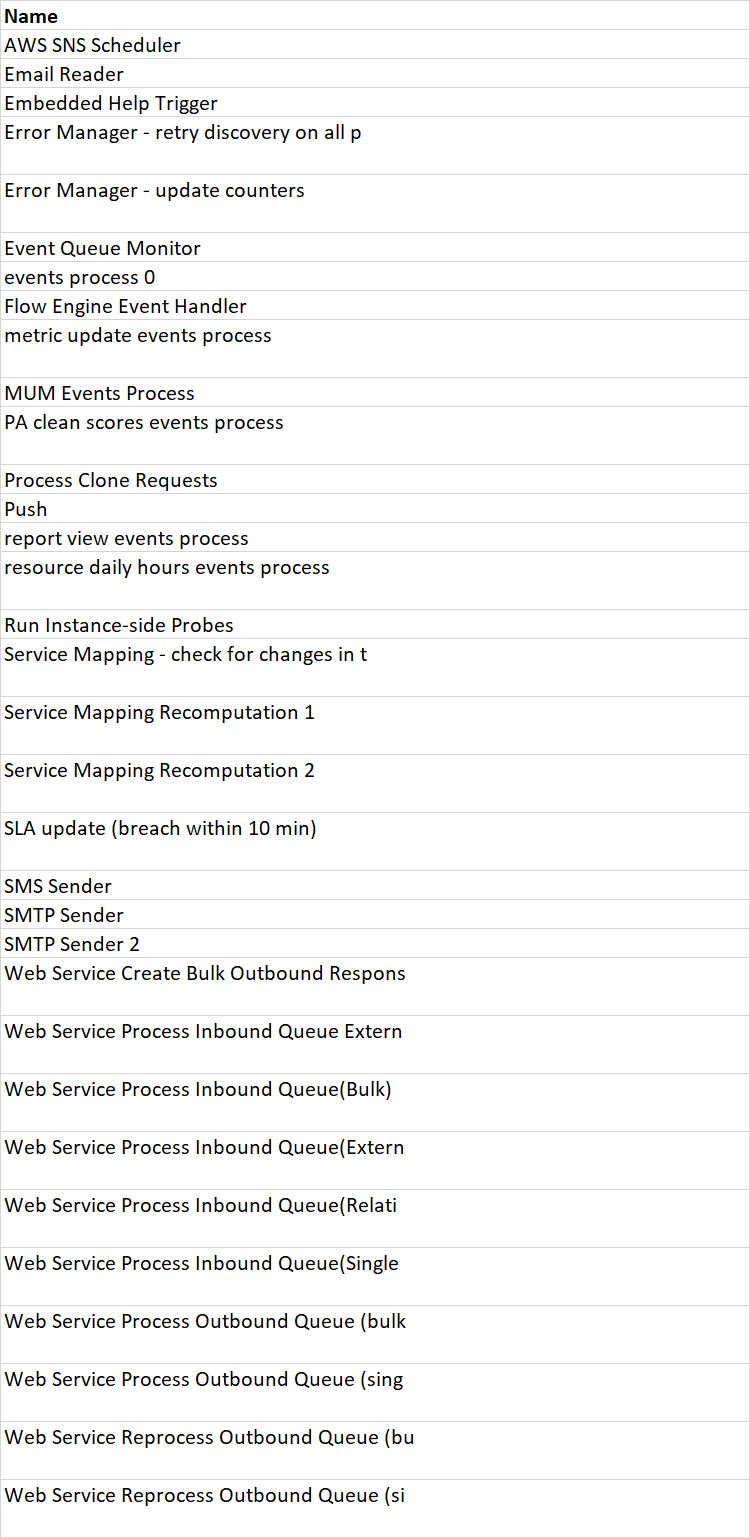
should not be deleted/decommissioned .I have list of below jobs frequently running in our system.
We figured that Service Mapping re computation job needs to be stopped as we have no ITOM SETUP in our environment.

Thank you .
Best Regards
satya
- Mark as New
- Bookmark
- Subscribe
- Mute
- Subscribe to RSS Feed
- Permalink
- Report Inappropriate Content
11-07-2019 02:59 AM
Greetings satya,
If you are having performance issues, or need help adjusting your scheduled jobs - I would seek help from HI support. https://hi.service-now.com.
-Andrew Barnes
Join me at Developer Blog
- Mark as New
- Bookmark
- Subscribe
- Mute
- Subscribe to RSS Feed
- Permalink
- Report Inappropriate Content
04-18-2026 05:58 AM
Hi there,
Scheduled jobs are one of the most common causes of instance performance degradation. Here's a structured approach to diagnose and resolve this.
Step 1: Identify the problematic jobs
Start by checking which jobs are consuming the most resources. Navigate to System Logs > Transactions (Background) and filter for transactions running longer than 60 seconds. The sys_trigger table holds all scheduled job definitions — cross-reference the transaction logs with this table to identify your top offenders.
You can also check System Scheduler > Scheduled Jobs and sort by "Last run time" to find jobs with unusually long execution windows.
Step 2: Analyze job execution patterns
A common issue is job contention — multiple heavy jobs scheduled at the same time (often midnight UTC). Navigate to System Scheduler > Scheduled Jobs and review the "Run" and "Next action" fields. If you see a cluster of jobs at the same time, that's likely contributing to your performance issues.
Look at whether any jobs are stuck or running on non-existent nodes. Check the "State" field — jobs showing "Running" for extended periods may be stuck and consuming resources indefinitely. KB article KB0723049 covers how to detect and resolve stuck scheduled jobs.
Step 3: Investigate the scripts
Once you've identified the slow jobs, review their scripts for common performance pitfalls:
- Unfiltered GlideRecord queries: A query like gr.query() without conditions scans the entire table. Always add encoded queries to limit scope (filter by sys_updated_on, state, assignment_group, etc.)
- Missing database indexes: If your script queries large tables with custom conditions, verify that appropriate indexes exist on the filtered fields
- Dot-walking in loops: Avoid dot-walking to reference fields inside while(gr.next()) loops — this generates additional database queries per record. Use gr.getValue('field') instead
- No batch processing: For large record operations, use GlideRecord.chooseWindow(start, end) to process records in smaller batches rather than loading everything at once. Note: there's a known behavior where chooseWindow() combined with orderBy() may not return properly sorted results on certain tables
Step 4: Implement preventive measures
- Stagger job schedules: Spread jobs across different times instead of clustering them. Even 5-10 minute offsets between jobs can significantly reduce contention
- Schedule heavy jobs off-peak: Run data-intensive jobs during off-business hours when user load is minimal
- Set appropriate frequencies: Review if hourly jobs truly need to run hourly — daily or even weekly may suffice
- Add job timeouts: Configure reasonable timeouts to prevent runaway scripts from consuming resources indefinitely
- Use GlideAggregate instead of GlideRecord for count/sum operations — it's significantly more efficient as it processes data at the database level
Step 5: Ongoing monitoring
Use System Diagnostics (Stats module) during the job's execution window to monitor real-time database connection pool utilization and thread usage. Set up a recurring review (monthly or quarterly) of your top 10 longest-running jobs to catch performance regressions early.
Could you share which specific jobs are causing the most impact? With that detail I can provide more targeted recommendations.
Useful references:
- Troubleshooting slow instance performance (KB0517241)
- GlideRecord Performance Pitfalls (KB0826993)
- Some information on Scheduled Jobs (KB0993106)
- Detecting stuck scheduled jobs (KB0723049)
- Best practices for mass updating records (KB0696028)
- 5 Ways to Troubleshoot your Instance Performance (Community Blog)