- Mark as New
- Bookmark
- Subscribe
- Mute
- Subscribe to RSS Feed
- Permalink
- Report Inappropriate Content
12-08-2020 04:39 PM
Hi all,
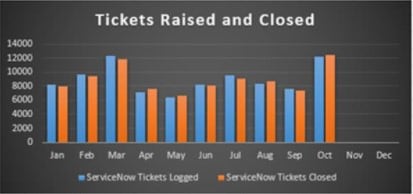
I would like to create a dashboard to display the "created" and "closed" fields from the "Task" table in a chart that have the columns stacked or side by side showing over a 12 month period.
I have been able to create these charts separately, but I want it to be in a combined chart like this:

How do I set up this inside the dashboard?
Your help is appreciated. Thank you.
Solved! Go to Solution.
- Labels:
-
Incident Management
-
Service Desk
- Mark as New
- Bookmark
- Subscribe
- Mute
- Subscribe to RSS Feed
- Permalink
- Report Inappropriate Content
12-08-2020 10:26 PM
Hi Tyron,
a dashboard is just a container for content blocks like reports. That means, you have to create a report first and then add this report to a dashboard.
However, creating a report from combined data sources is a bit more complex, so I wrote an article about it: https://community.servicenow.com/community?id=community_article&sys_id=c8929bd41bc5ac10d2ccea89bd4bc...
- Mark as New
- Bookmark
- Subscribe
- Mute
- Subscribe to RSS Feed
- Permalink
- Report Inappropriate Content
12-09-2020 04:53 AM
Hi
This worked beautifully and now I can apply this to other reports too.
- Mark as New
- Bookmark
- Subscribe
- Mute
- Subscribe to RSS Feed
- Permalink
- Report Inappropriate Content
03-17-2021 07:05 PM
To achieve this, you need to create a separate "data-set" within your existing report.
The base report will display "Created" and other report (called data-set) will contain "Closed".
Go to your base report and click "Add Dataset". Use the "Closed" filter here (instead of "Created").
Adjust the various other fields (Type, Configure, Style). Save your data-set and click Run to include this
data-set into your existing report.

When you are happy with the results, add this report into your existing Dashboard.