- Mark as New
- Bookmark
- Subscribe
- Mute
- Subscribe to RSS Feed
- Permalink
- Report Inappropriate Content
11-09-2023 03:07 AM
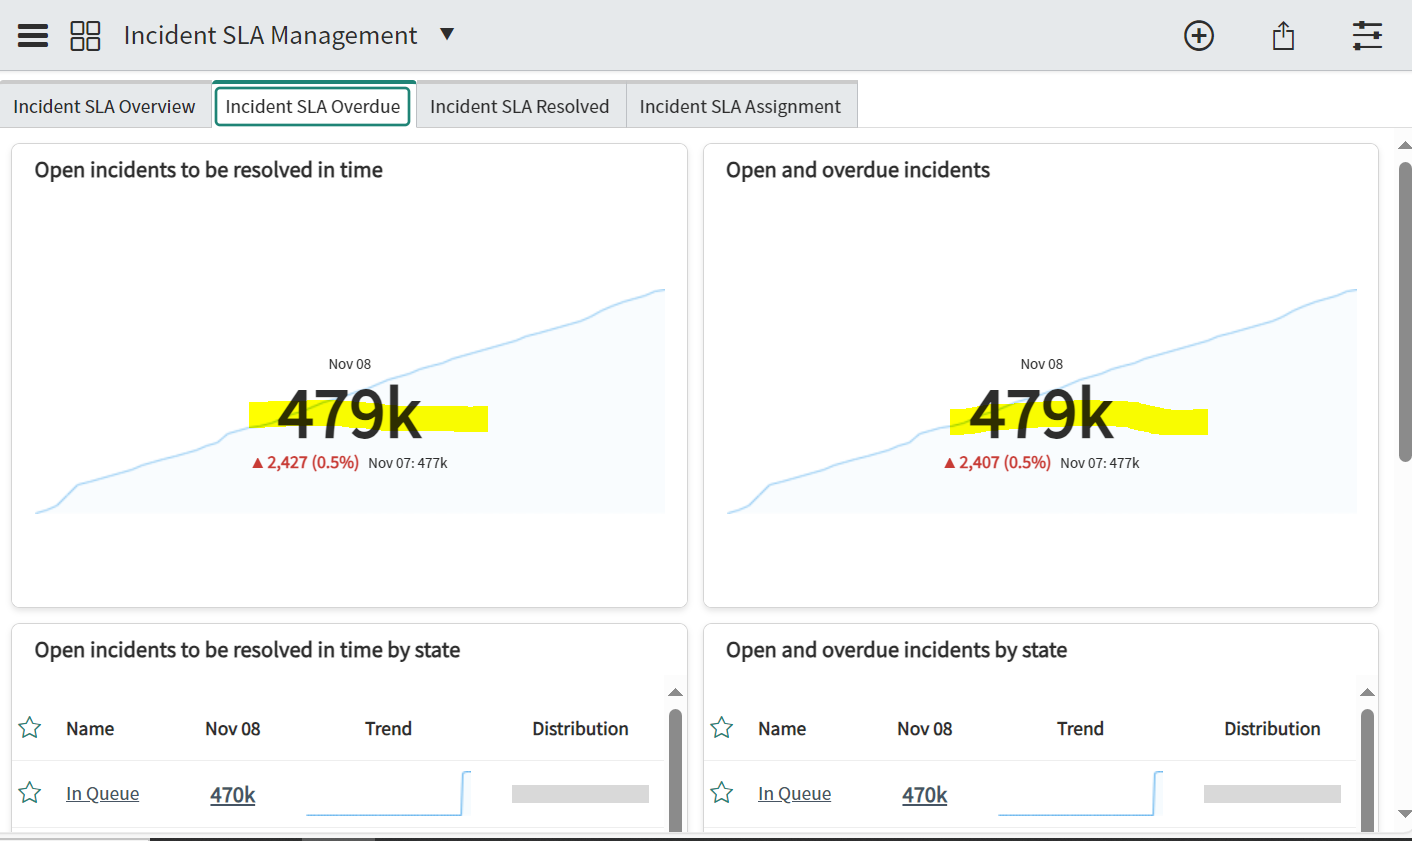
I guess the highlighted data showing in the dashboard is very high. Pls guide me whether it's actual data or not.
Solved! Go to Solution.
- Mark as New
- Bookmark
- Subscribe
- Mute
- Subscribe to RSS Feed
- Permalink
- Report Inappropriate Content
11-10-2023 01:59 AM
Hi @Hiranmayee Moha ,
Let me try yo explain how you can see where data is coming from. In my example I have utilized the incident management dashboard in my PDI, but the process for you will be the same. Please also notice, that the do these steps, admin access is required:
1. From a Dashboard click in the right corner and click edit content:

2. Under related links, click launch dependency assessment:

3. By doing this, you will see the Performance Analytics structure which has been made:

4. Start from below the widgets, as widgets is "just" handling the visualization itself

5. On each formula indicator, automated indicator and indicator source, you need to verify which table has been utilized and which condition is utilized.
6. When clicking the options, you have the following to select:

Indicator Source = show the concrete table that has been queried together with first set of conditions. You can click edit to verify this settings.
Automated indicator = second set of conditions together with aggregate (count, sum, etc.). This is based on Indicator source.
Formula indicator = calculation / formula based on automated indicators
Furthermore, you can also select scores, which will show you the score captured by the automated indicators, might be utilized by formula indicators and is baseline for a widget showing data:

If my answer has helped with your question, please mark my answer as accepted solution and give a thumb up.
best regards
Anders
If my answer has helped with your question, please mark my answer as the accepted solution and give a thumbs up.
Best regards
Anders
Rising star 2024
MVP 2025
linkedIn: https://www.linkedin.com/in/andersskovbjerg/
- Mark as New
- Bookmark
- Subscribe
- Mute
- Subscribe to RSS Feed
- Permalink
- Report Inappropriate Content
11-15-2023 12:38 AM
Hi @Hiranmayee Moha ,
Basic, you start with an indicator source where you select which table to query and under which conditions. After this, you create an assosiated automated indicator which you relate to e.g. breakdowns and data collection job.
If you're new to PA, I would recommend you to take the ServiceNow available training first, as there are many different selections that should be considered based on the business requirement. https://nowlearning.servicenow.com/lxp/en/pages/now-learning-get-certified?id=amap_detail&summary_id...
If my answer has helped with your question, please mark my answer as accepted solution and give a thumb up.
best regards
Anders
If my answer has helped with your question, please mark my answer as the accepted solution and give a thumbs up.
Best regards
Anders
Rising star 2024
MVP 2025
linkedIn: https://www.linkedin.com/in/andersskovbjerg/
- Mark as New
- Bookmark
- Subscribe
- Mute
- Subscribe to RSS Feed
- Permalink
- Report Inappropriate Content
11-09-2023 05:20 AM
Hi @Hiranmayee Moha ,
I don't understand your question? What is it that you're asking? is the number high according to what?
If my answer has helped with your question, please mark my answer as accepted solution and give a thumb up.
best regards
Anders
If my answer has helped with your question, please mark my answer as the accepted solution and give a thumbs up.
Best regards
Anders
Rising star 2024
MVP 2025
linkedIn: https://www.linkedin.com/in/andersskovbjerg/
- Mark as New
- Bookmark
- Subscribe
- Mute
- Subscribe to RSS Feed
- Permalink
- Report Inappropriate Content
11-10-2023 01:37 AM
Apologies for not explaining properly. My query is dashboard shows 59K open incidents to be resolved in time, and I am not aware of how analytics hub data calculated. Also number of records show around 5,000. Would you pls help me out how 59K data is reflecting in dashboard and how will I confirm that it's correct data or do I need to configure anything?
Thanks In advance for your help.

Analytics Hub view


- Mark as New
- Bookmark
- Subscribe
- Mute
- Subscribe to RSS Feed
- Permalink
- Report Inappropriate Content
11-10-2023 01:59 AM
Hi @Hiranmayee Moha ,
Let me try yo explain how you can see where data is coming from. In my example I have utilized the incident management dashboard in my PDI, but the process for you will be the same. Please also notice, that the do these steps, admin access is required:
1. From a Dashboard click in the right corner and click edit content:
2. Under related links, click launch dependency assessment:
3. By doing this, you will see the Performance Analytics structure which has been made:
4. Start from below the widgets, as widgets is "just" handling the visualization itself
5. On each formula indicator, automated indicator and indicator source, you need to verify which table has been utilized and which condition is utilized.
6. When clicking the options, you have the following to select:
Indicator Source = show the concrete table that has been queried together with first set of conditions. You can click edit to verify this settings.
Automated indicator = second set of conditions together with aggregate (count, sum, etc.). This is based on Indicator source.
Formula indicator = calculation / formula based on automated indicators
Furthermore, you can also select scores, which will show you the score captured by the automated indicators, might be utilized by formula indicators and is baseline for a widget showing data:
If my answer has helped with your question, please mark my answer as accepted solution and give a thumb up.
best regards
Anders
If my answer has helped with your question, please mark my answer as the accepted solution and give a thumbs up.
Best regards
Anders
Rising star 2024
MVP 2025
linkedIn: https://www.linkedin.com/in/andersskovbjerg/
- Mark as New
- Bookmark
- Subscribe
- Mute
- Subscribe to RSS Feed
- Permalink
- Report Inappropriate Content
11-10-2023 03:18 AM
Hi @AndersBGS ,
You have explained very well, now I can figure out how the data is reflecting in dashboard.
Really appreciate for your help.
Thank you.