How to get a scrum team velocity chart that shows data points and trend
- Mark as New
- Bookmark
- Subscribe
- Mute
- Subscribe to RSS Feed
- Permalink
- Report Inappropriate Content
08-16-2022 01:46 PM
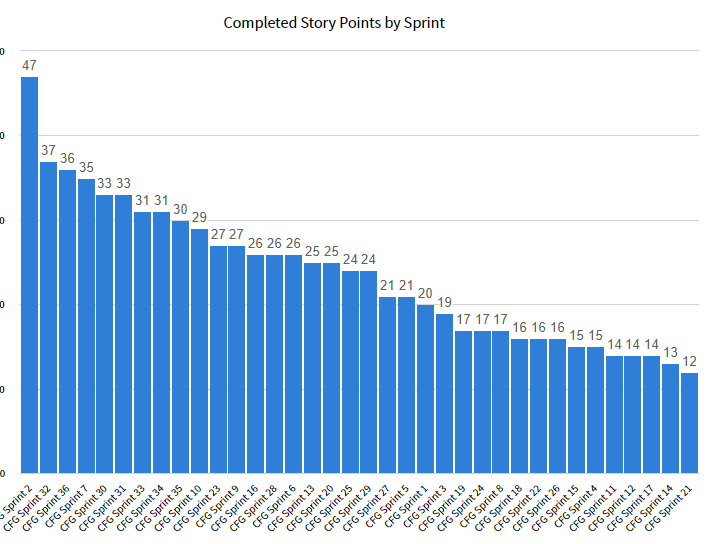
I need to have a chart for my team's velocity that shows committed and completed by sprint. Heck I will even take just completed to make it easier. I would like to see a trend (so sprint over sprint over time) and see the number so I can see what the actual velocity of each sprint was.
I have looked at the Agile 2.0 dashboard and it does not show the data points. I have to hover over each to see what each number is. Also it does not go further back than 10 sprints. That may be for real estate but would be nice to see a few more. I dont see anyway to customize this table to show data points.

I have tried creating my own and am struggling with the time series and or sorting. I can create a basic bar chart of the total point count by sprint. But its not in any order so does not provide trends.

I have tried slicing and dicing all the other chart options and cant seem to get this to work.
Any help to create this or to customize the Agile 2.0 dashboard would be greatly appreciated.
- Labels:
-
Reporting
- Mark as New
- Bookmark
- Subscribe
- Mute
- Subscribe to RSS Feed
- Permalink
- Report Inappropriate Content
08-20-2022 06:24 PM
If the dashboard is lacking I would leave it behind and build the best solution that fits.. Try using multi-dataset reporting - its virtually putting reports with a transparent backgrounds over each other- so for instance report 1 would be committed, and report 2 would be completed, only certain report types can be used like line charts
- Mark as New
- Bookmark
- Subscribe
- Mute
- Subscribe to RSS Feed
- Permalink
- Report Inappropriate Content
08-20-2022 07:02 PM
Hi Christine,
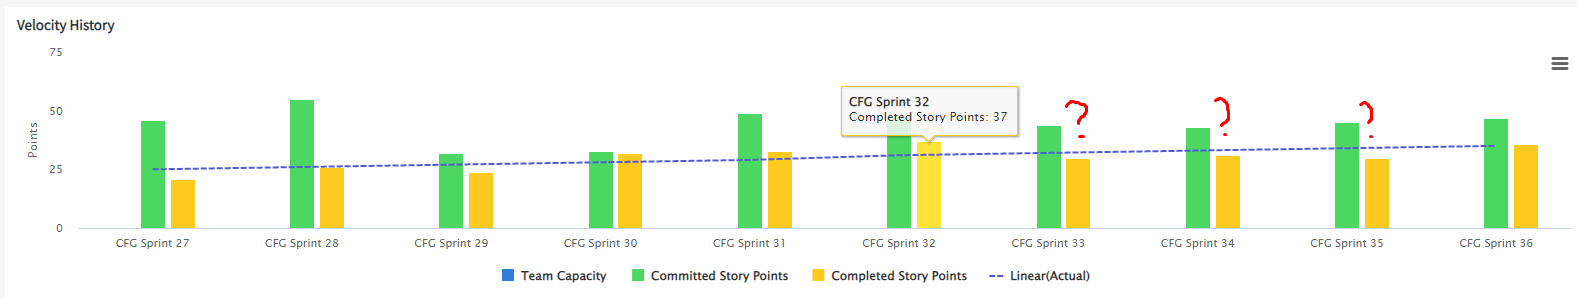
The Agile 2.0 dashboard has a Report for Velocity History , that covers below:
|
Velocity History |
Bar chart |
Gain an insight on the overall velocity of the team for the past 10 sprints. Understand if the team is achieving a stable, predictable velocity, and is meeting the commitments. The Team Velocity History report comprises the following series per sprint that can be hidden or displayed based on your preference:
|
You can also customize your reports :
- Navigate to All > Performance Analytics > Indicators > Automated Indicators.
- Search for and open the required indicator.
For example, if you want to customize the Sprint Burnup report, open Scrum: Sum of story points of completed stories in current sprint from the list of indicators.
- In the Additional conditions section, modify the conditions according to your preferences.
- Click Update.
Mark my answer correct & Helpful, if Applicable.
Thanks,
Sandeep
- Mark as New
- Bookmark
- Subscribe
- Mute
- Subscribe to RSS Feed
- Permalink
- Report Inappropriate Content
02-14-2024 12:58 AM
Hi,
Any idea how is Linear (Actual) calculated in Velocity History report.
Regards,
Faizu