Need Help to build time series graph in performance analytic
- Mark as New
- Bookmark
- Subscribe
- Mute
- Subscribe to RSS Feed
- Permalink
- Report Inappropriate Content
05-31-2016 04:22 AM
Hi Everyone,
I am trying to build a Time Series( Line Graph) calculating average of a particular field. It is successfully calculating the average, the problem is for everyday it is showing the same average. I want to breakdown the report based on another field. I have created a breakdown but it is not working. Another doubt, is that i have a 'Timestamp' date/time field and i want the data to show average according to the dates stated in that field, instead it is referring to the system's 'Created' Field's date.
Also, what is the significance of 7d running SUM, 7d running AVG, etc. I am calculating Average on Field's value, when selecting the 7d running SUM, the graph shows cumulative sum of the average, but the same for 7d running AVG is not happening. The job i have created is running successfully. Need some guidance for creating this report. Kindly let me know if anyone has any clue regarding this.
Thanks in advance,
Shipra Shaw
- Labels:
-
Performance Analytics
- Mark as New
- Bookmark
- Subscribe
- Mute
- Subscribe to RSS Feed
- Permalink
- Report Inappropriate Content
06-20-2016 12:29 PM
Hi Gaurav,
What are you trying to calculate? Is it the average number of incidents or something else? I'am asking so that I can check some of my existing indicator formulas to compare and I can let you know if anything is missing.
Thanks,
Sowmya
- Mark as New
- Bookmark
- Subscribe
- Mute
- Subscribe to RSS Feed
- Permalink
- Report Inappropriate Content
06-20-2016 12:41 PM
Hi Sowmya,
Thanks for the reply.
We are really struggling with the formula indicators. We have tried to couple of formula indicators for different requirements but all of them are resulting in wrong values and dashboard.
One of the Use case: Get the % of incident logged from monitoring tool month wise.
We have created two automatic indicators. One is getting Event incidents and second is getting all incidents. Both of these indicators are giving us correct count 'By Month Sum +'. But when we are using it in formula indicator to get the % then we are not getting the correct result.
Regards,
Gaurav Banga
- Mark as New
- Bookmark
- Subscribe
- Mute
- Subscribe to RSS Feed
- Permalink
- Report Inappropriate Content
06-20-2016 01:12 PM
One example of wrong output:
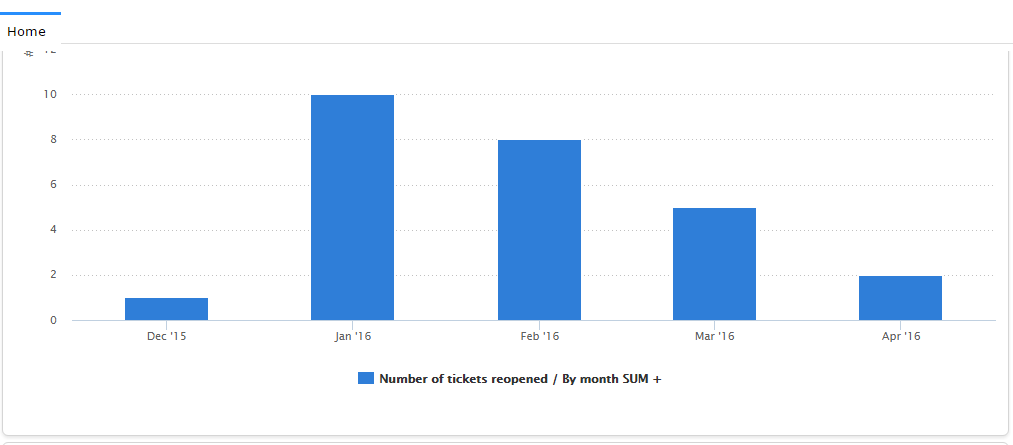
Below is the indicator to get count of reopened incident.

Just to check what we get after we * it by 100 and / by 100

Below is the output of above formula indicator. This makes us scratch our head about how formula indicators work:-).

- Mark as New
- Bookmark
- Subscribe
- Mute
- Subscribe to RSS Feed
- Permalink
- Report Inappropriate Content
06-20-2016 01:25 PM
In this case I think it should be (Number of re-opened tickets /total number of total incidents) *100
- Mark as New
- Bookmark
- Subscribe
- Mute
- Subscribe to RSS Feed
- Permalink
- Report Inappropriate Content
06-20-2016 01:34 PM
We are using the same formula, but to test the formula indicator functionality we were just checking the output of * the indicator by 100, then / it by 100. What should be the output according to you.

Actual formula we used:

First Indicator Ouput:

Second indicator Output

Widget for Formula Indicator

Looking at the above Formula indicator output for Jan, Feb, Mar and rest, do you think it's the expected result for AVG.