Define the kind of data or process that you want to view and analyse in your graph. You must select a specific table (parent table) that has the data that you want to analyse.
Before you begin
Role required: sn_process_optimization_analyst, sn_process_optimization_power_user,
or sn_process_optimization_admin
Procedure
-
Open your project, and select the Table Configurations tab.
-
Select New.
A new Table Configuration page is displayed.
-
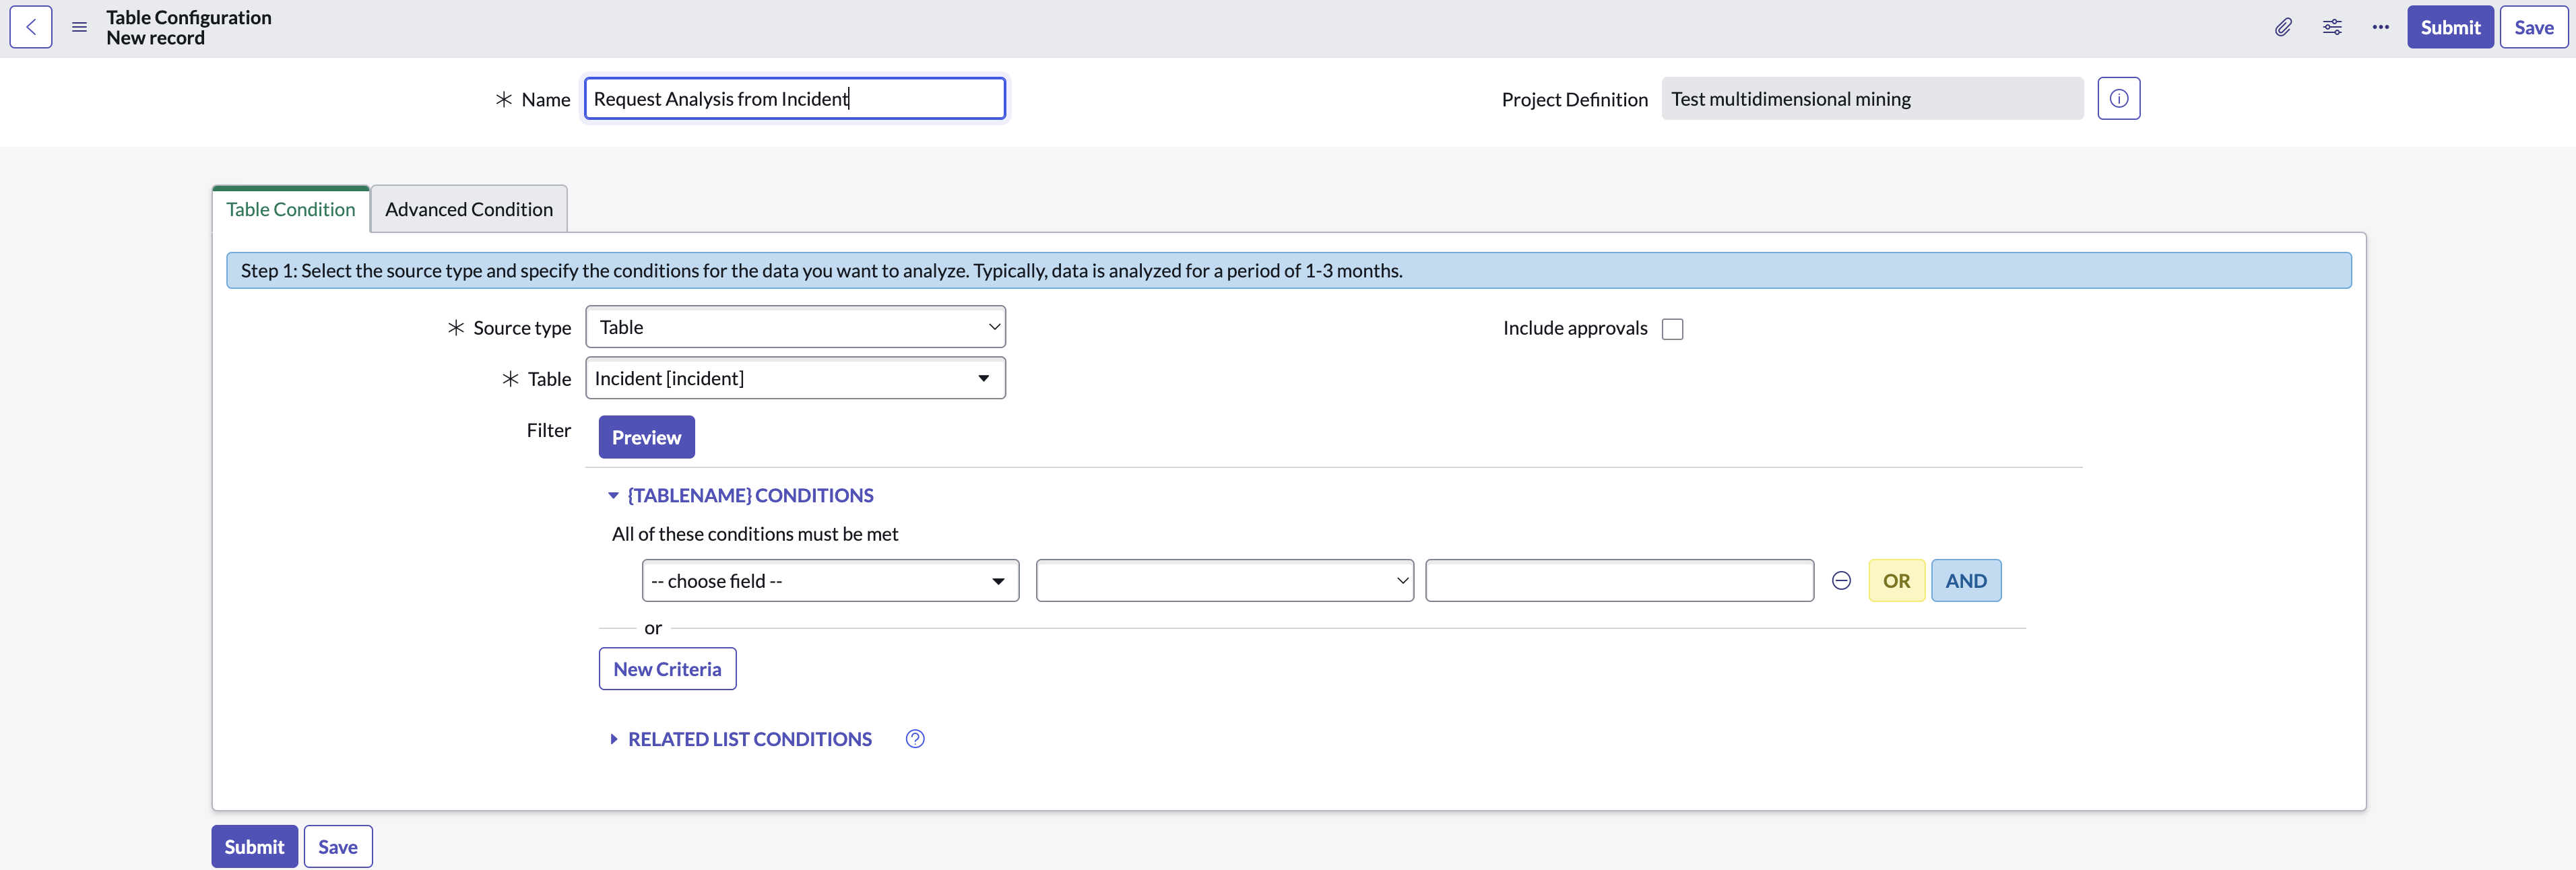
Enter a name for the table configuration in the Name
field.
-
In the Table Condition tab, fill in the fields.
Table 1. Table Condition fields
| Field |
Description |
| Source type |
The source for the table configuration. You can select a source type:
- Table: Any database table
- Report source: A table that has reports
- Archived data: An archived table
|
| Include approvals |
Whether approvals are included. |
| Table |
Select the appropriate table. |
| Filter |
Use the conditions in the Filter section to select the data that you want to analyze.Note: Avoid long transaction times by limiting data to 1 to 3 months period. Select Preview
to see the number of records available for the set filter. |
-
Select Submit to save the table configuration.
You are taken to the Table Configuration page displaying the table configuration that you have created. Configure an activity definition for the table configuration. For more information, see Configure an activity definition