캠페인 개요 및 캠페인 분석 대시보드
컨텐츠 분석은 사용자 상호 작용에 대한 데이터를 수집하고 캠페인 관리자가 캠페인의 효과를 판단하는 데 도움이 되는 시각화를 생성합니다.
컨텐츠 분석을 사용하여 캠페인의 효과와 직원에게 제공되는 컨텐츠를 측정합니다. 컨텐츠 분석은 캠페인을 개선하는 데 도움이 되는 여러 리소스 중 하나입니다. 다른 자원에 대한 자세한 내용은 다음 문서를 참조하십시오 캠페인 효과성 분석.
캠페인에 대해 추적이 활성화되면 컨텐츠 분석이 데이터 시각화를 생성합니다. 추적을 사용하도록 설정하는 방법에 대한 자세한 내용은 다음 문서를 참조하십시오 캠페인 생성.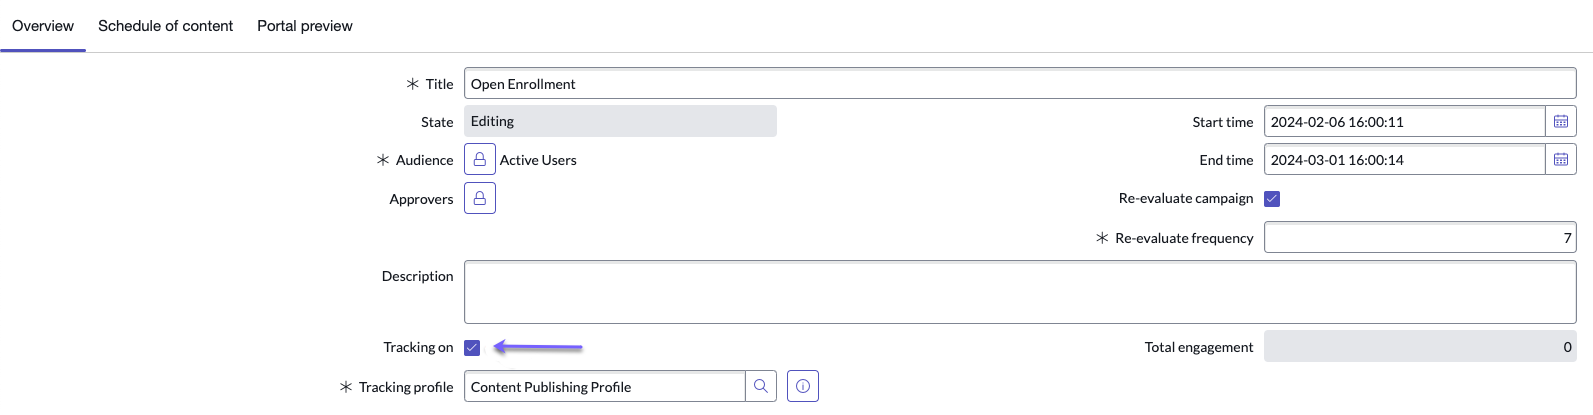
주:
데이터가 대시보드에 표시될 때까지 게시 후 최소 24시간을 기다리는 것이 좋습니다.
상호작용 추적
대시보드에는 콘텐츠에 대한 사용자 상호작용과 같은 특정 매개변수에 대한 데이터 시각화가 표시됩니다.
주:
- 상호작용은 다운로드, 링크 클릭, 할 일 완료 또는 비디오 재생과 같이 사용자가 수행하는 작업입니다.
- 노출은 사용자에게 표시되는 콘텐츠의 인스턴스입니다. 사용자가 컨텐츠를 볼 때마다 상호작용으로 계산됩니다.
컨텐츠 분석은 콘텐츠 유형에 따라 다음과 같은 사용자 상호작용을 추적합니다. 포털에서 콘텐츠가 렌더링되면 시스템은 이를 노출로 계산합니다. 직원이 콘텐츠를 클릭하면 시스템은 콘텐츠 유형에 따라 클릭스루, 다운로드 또는 재생으로 계산합니다.
- 배너 클릭 연결
- 배너 임프레션
- 달력 다운로드
- 달력 임프레션
- 이메일 클릭 연결
- 이벤트 다운로드
- 이벤트 임프레션
- 이미지 기반 링크 클릭 연결
- 이미지 기반 링크 노출
- 링크 클릭 연결
- 서식 있는 컨텐츠 클릭 연결
- 서식 있는 컨텐츠 임프레션
- 할 일 완료
- 할 일 임프레션
- 비디오 임프레션
- 비디오 재생됨
캠페인 개요 대시보드
캠페인 개요 대시보드에는 종결된 작업 및 사용자 작업을 포함하여 캠페인별 성과 지표가 표시됩니다.
| 시각화 | 설명 |
|---|---|
| 캠페인 작업 오픈 | 캠페인별 상태별 작업 수입니다. 각 셀의 값은 해당 상태 및 캠페인의 작업 목록으로 연결됩니다. |
| 이번 주 캠페인 작업 종결 | 이번 주에 종결된 작업 수를 보여주는 누적 막대형 차트입니다. 막대 위로 마우스를 이동하여 캠페인과 관련된 메트릭을 봅니다. |
| 시간에 따른 이벤트 활동 | 컨텐츠에 대한 총 사용자 상호작용 수입니다. |
| 컨텐츠별 시간에 따른 이벤트 | 콘텐츠와의 사용자 상호작용 수이며, 여기서 각 라인은 콘텐츠의 일부를 나타냅니다. 선 위에 마우스를 올리면 콘텐츠와 관련된 메트릭을 볼 수 있습니다. |
| 작업별 시간에 따른 이벤트 | 컨텐츠와 사용자 상호작용의 수이며, 여기서 각 라인은 상호작용 유형을 나타냅니다. 선 위에 마우스를 올리면 상호작용 유형과 관련된 메트릭을 볼 수 있습니다. |
| 작업 활동 | 총 작업 수와 비교하여 각 유형의 상호작용 및 노출의 비율을 보여주는 원형 차트입니다. |
| 상위 컨텐츠 | 가장 많이 액세스한 콘텐츠를 보여주는 막대형 차트입니다. 막대를 클릭하면 특정 컨텐츠 및 작업에 대한 메트릭이 표시됩니다. |
| 상위 알림 | 캠페인 기간 동안 가장 많이 클릭된 이메일 알림을 보여주는 막대형 차트입니다. |
캠페인 분석 대시보드
캠페인 분석 대시보드에는 캠페인 참여, 할 일 및 영향에 대한 데이터가 표시됩니다. 필터를 사용하여 시각화에 포함할 메트릭을 지정합니다. 캠페인 및 캠페인 성공 목표 중에서 선택한 다음 캠페인 또는 캠페인 성공 목표를 지정합니다.
| 시각화 | 설명 |
|---|---|
| 캠페인 정보 | 캠페인 제목과 대상 표시 |
| 실행 중인 일수 | 캠페인의 시작 및 종료 날짜와 현재까지 캠페인이 실행된 총 일수 |
| 총 계약 | 이 메트릭은 캠페인과 상호작용하는 직원 수에 대한 통계를 제공합니다. 대상 포털을 방문하여 클릭하거나 보는 방식으로 컨텐츠에 참여한 캠페인 대상의 백분율을 표시합니다. 포털을 방문한 적이 없는 캠페인 대상은 이 계산에 포함되지 않습니다. 주: 현재 이메일 링크 클릭은 익명으로 추적되며 캠페인 참여 점수에 영향을 미치지 않습니다. |
| 시간 경과에 따른 이벤트 활동 | 컨텐츠에 대한 총 사용자 상호작용 수입니다. |
| 콘텐츠별 시간에 따른 이벤트 | 콘텐츠와의 사용자 상호작용 수이며, 여기서 각 라인은 콘텐츠의 일부를 나타냅니다. 선 위에 마우스를 올리면 콘텐츠와 관련된 메트릭을 볼 수 있습니다. |
| 작업별 시간에 따른 이벤트 | 컨텐츠와 사용자 상호작용의 수이며, 여기서 각 라인은 상호작용 유형을 나타냅니다. 선 위에 마우스를 올리면 상호작용 유형과 관련된 메트릭을 볼 수 있습니다. |
| 작업 활동 | 총 작업 수와 비교하여 각 유형의 상호작용 및 노출의 비율을 보여주는 원형 차트입니다. |
| 상위 컨텐츠 | 가장 많이 액세스한 콘텐츠를 보여주는 막대형 차트입니다. 막대를 클릭하면 특정 컨텐츠 및 작업에 대한 메트릭이 표시됩니다. |
| 상위 알림 | 캠페인 기간 중 가장 많이 분산된 알림을 보여주는 막대형 차트입니다. |
| 시각화 | 설명 |
|---|---|
| 모든 캠페인 할 일 | 상태별 할 일에 대한 지난 12개월 동안의 캠페인 데이터를 막대형 차트로 표시합니다.
|
| 시각화 | 설명 |
|---|---|
| 캠페인 영향 | 캠페인 영향은 설정된 캠페인 성공 목표와 관련된 데이터를 보여줍니다. 캠페인 성공 목표 생성에 대한 자세한 내용은 다음 문서를 참조하십시오 캠페인 성공 목표 작성. 캠페인 성공 목표를 선택하여 캠페인 진행 상황을 보여주는 차트를 봅니다. 캠페인 영향 차트에는 다음이 표시됩니다.
|