The simple list data visualization is used to show selected raw data from a source table.
Before you begin
Role required: Anyone with access to data can create a visualization of that data on any dashboard that they can edit. Users with the itil, report_user, admin, or viz_creator role can create a visualization in the Visualization Designer. If you create a visualization in the Visualization Designer, it is saved to the Library. For more information on access, see Report_view access control and Platform Analytics roles.
About this task
The list visualization not only shows selected data directly from the source table, but it enables you to let the work with the information, including personalizing, reordering, filtering, and sorting the columns. You can also
choose to hide one or more of these capabilities.
Procedure
-
Follow the first steps to Create a simple list visualization in the Visualization Designer:
-
Navigate to .
-
Select New.
-
Select the List Simple (
 ) visualization type.
-
In the Data section Choose the Task [task] table.
-
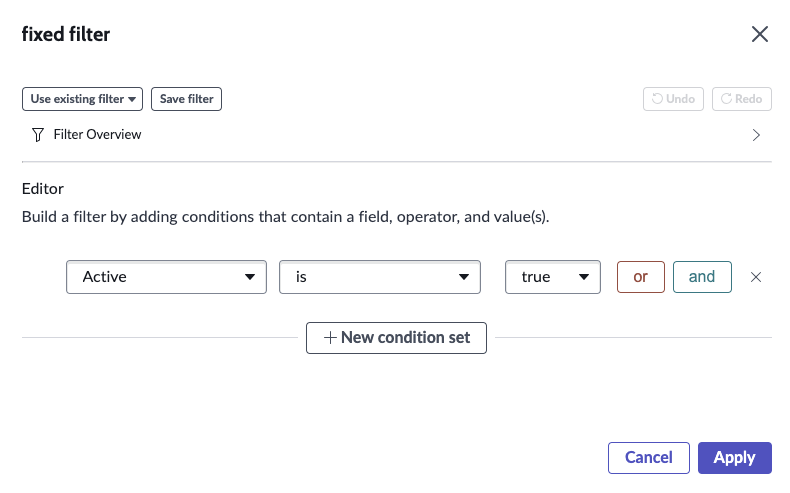
Select Edit fixed filter to choose which data to show in the list.
Because we're interested in active tasks, set the condition to
Active is true and select
Apply.
-
Under Default display, edit the columns you want to show.
Add the Due date column. The default number of displayed columns is 5. To see all of the chosen fields, increase the Number of displayed columns to 7.
-
Add a group by.
When your list is very long, you can group by one of the fields. Grouped lists are collapsed to just one line for each entry in the field which the user can expand. Group this list by state.
-
Maximum rows and Hide the View all footer.
Maximum rows determines the number of rows from the list to show at runtime. The View all link at the bottom of the list enables the user to show all of the records in the list or in the selected group by. Hide that link to
show only the maximum number of rows.
-
Configure end-user capabilities.
Because you want to make sure the user sees all the information you select, hide the option to personalize, column filtering, and column sorting.
- Hide option to personalize columns
- Disables the ability to add and remove columns, and to change the sort order.
- Disable dot-walk
- When column personalization is enabled, you can still disable the ability to navigate to related tables (dot-walking).
- Hide option to drag and drop columns
- Disables reordering the columns by dragging them.
- Hide option to group records
- Disables grouping the records by a selected field.
- Hide column resizing
- Disables resizing column widths.
- Hide column filtering
- Disables filtering from the column heading.
- Hide column sorting
- Disables sorting the list from the column heading.
-
In the Header section, leave the header and title visible and title the visualization All Active Tasks.
Leave the total number of records, last refresh information, and the option to refresh visible.
-
In the Advanced section, leave Hide inline editing unselected.
When selected, users can't edit any of the cells in the list. The ability to edit enables the user to change who a task is assigned to or its due date, for example.
Result
You've created a list visualization grouped by state that the user can edit and show all records on.