Using the Capacity Console
The Capacity Console is a tool designed for monitoring, managing, and optimizing resource capacities across territories and demand channels.
It provides an intuitive, visual representation of capacity utilization, empowering capacity planners to make data-driven decisions and improve operational efficiency.
주:
To use Capacity Console, you must activate the Field Service Advanced Capacity and Reservations management (com.snc.fsm_advanced_capacity_management) plugin. For more information, see Activate Field Service Capacity console.
- Comprehensive capacity view
- The Capacity Console offers a detailed and visual overview of capacity utilization. Key views include:
- Territory view:
- Displays resource capacity data for specific territories, with impacted demand channels listed underneath. For more information, see Create a Field Service territory.
- Provides insights into planned, allocated, and forecasted capacities.
- Demand channel view:
- Highlights demand channels at the top, with impacted territories listed underneath. For more information, see Create a demand channel.
- Offers visibility into demand channels and their associated capacities.
- Territory view:
- Customizing the Capacity Console
- Tailor the Capacity Console to align with your organization’s needs.
- Set thresholds: Define thresholds for capacity utilization quickly to identify areas needing attention. The following are the example thresholds. However, you can customize them as your business terminology and needs.
- Underutilized: Below capacity limits.
- Optimalutilized: Efficiently using resources.
- Overutilized: Exceeding capacity limits.
주:You can also customize color codes and legend labels to match your business terminology and clear categorization. - Save filter preferences: Save your chosen filter settings for quick and easy access in future sessions.
- Customize calendar capacity data parameters: Update the calendar to prioritize specific metrics:
- Replace existing metrics (for example, "Used Capacity" with "Unused Capacity").
- Add new fields using the Application Field Set: Capacity Console events fields. For more information, see Activate Field Service Capacity console.
- Set thresholds: Define thresholds for capacity utilization quickly to identify areas needing attention. The following are the example thresholds. However, you can customize them as your business terminology and needs.
- Refining data with the filters
- Customizable filters at the top of the console enable for tailored data views.
- Default Filters: Preselected filters display the most relevant data for quick insights.
- Custom Preferences: Adjust and save filters to suit specific business needs.
- Territory filter: Focus on specific territories to understand their capacity and demand.
- Demand channel filter: Refine data by additional parameters like demand channels.
- Group By filter: Group data by demand channel or territory.
- Unit filter: View capacity in terms of hours or tasks (for example, focusing on underperforming territories for a given week).
- Advanced filter: Use thresholds to analyze data. Example, selecting UnderUtilized displays capacities below 25%.
- Calendar features
- The calendar in the Capacity Console provides flexible options to view and analyze data over time:
- Flexible Date Ranges: Adjust calendar settings to view data for specific timeframes, enabling better planning and trend analysis.
- Default Views:
- Week view
- Two-Week view
- Manual refresh required: Actions that impact calendar data, such as changes made in the Capacity Console or platform, require a manual refresh to display the latest data.
Use cases
The following are a few use cases for the Capacity Console
- Resource allocation: Identify underutilized territories using filters and reassign agents from low-demand territories to nearby high-demand territories.
- Demand analysis: Use the Two-Week View to forecast future demand and make proactive resource adjustments to meet anticipated needs.
- Advanced filtering: Focus on overutilized territories to resolve bottlenecks and Analyze optimally used territories to maintain efficiency.
- Demand channel insights: Analyze capacity and demand metrics from a demand channel perspective and provide tailored data views for specific customer needs.
Visual overview of the Capacity Console
The following snapshot illustrates the Capacity Console, showcasing: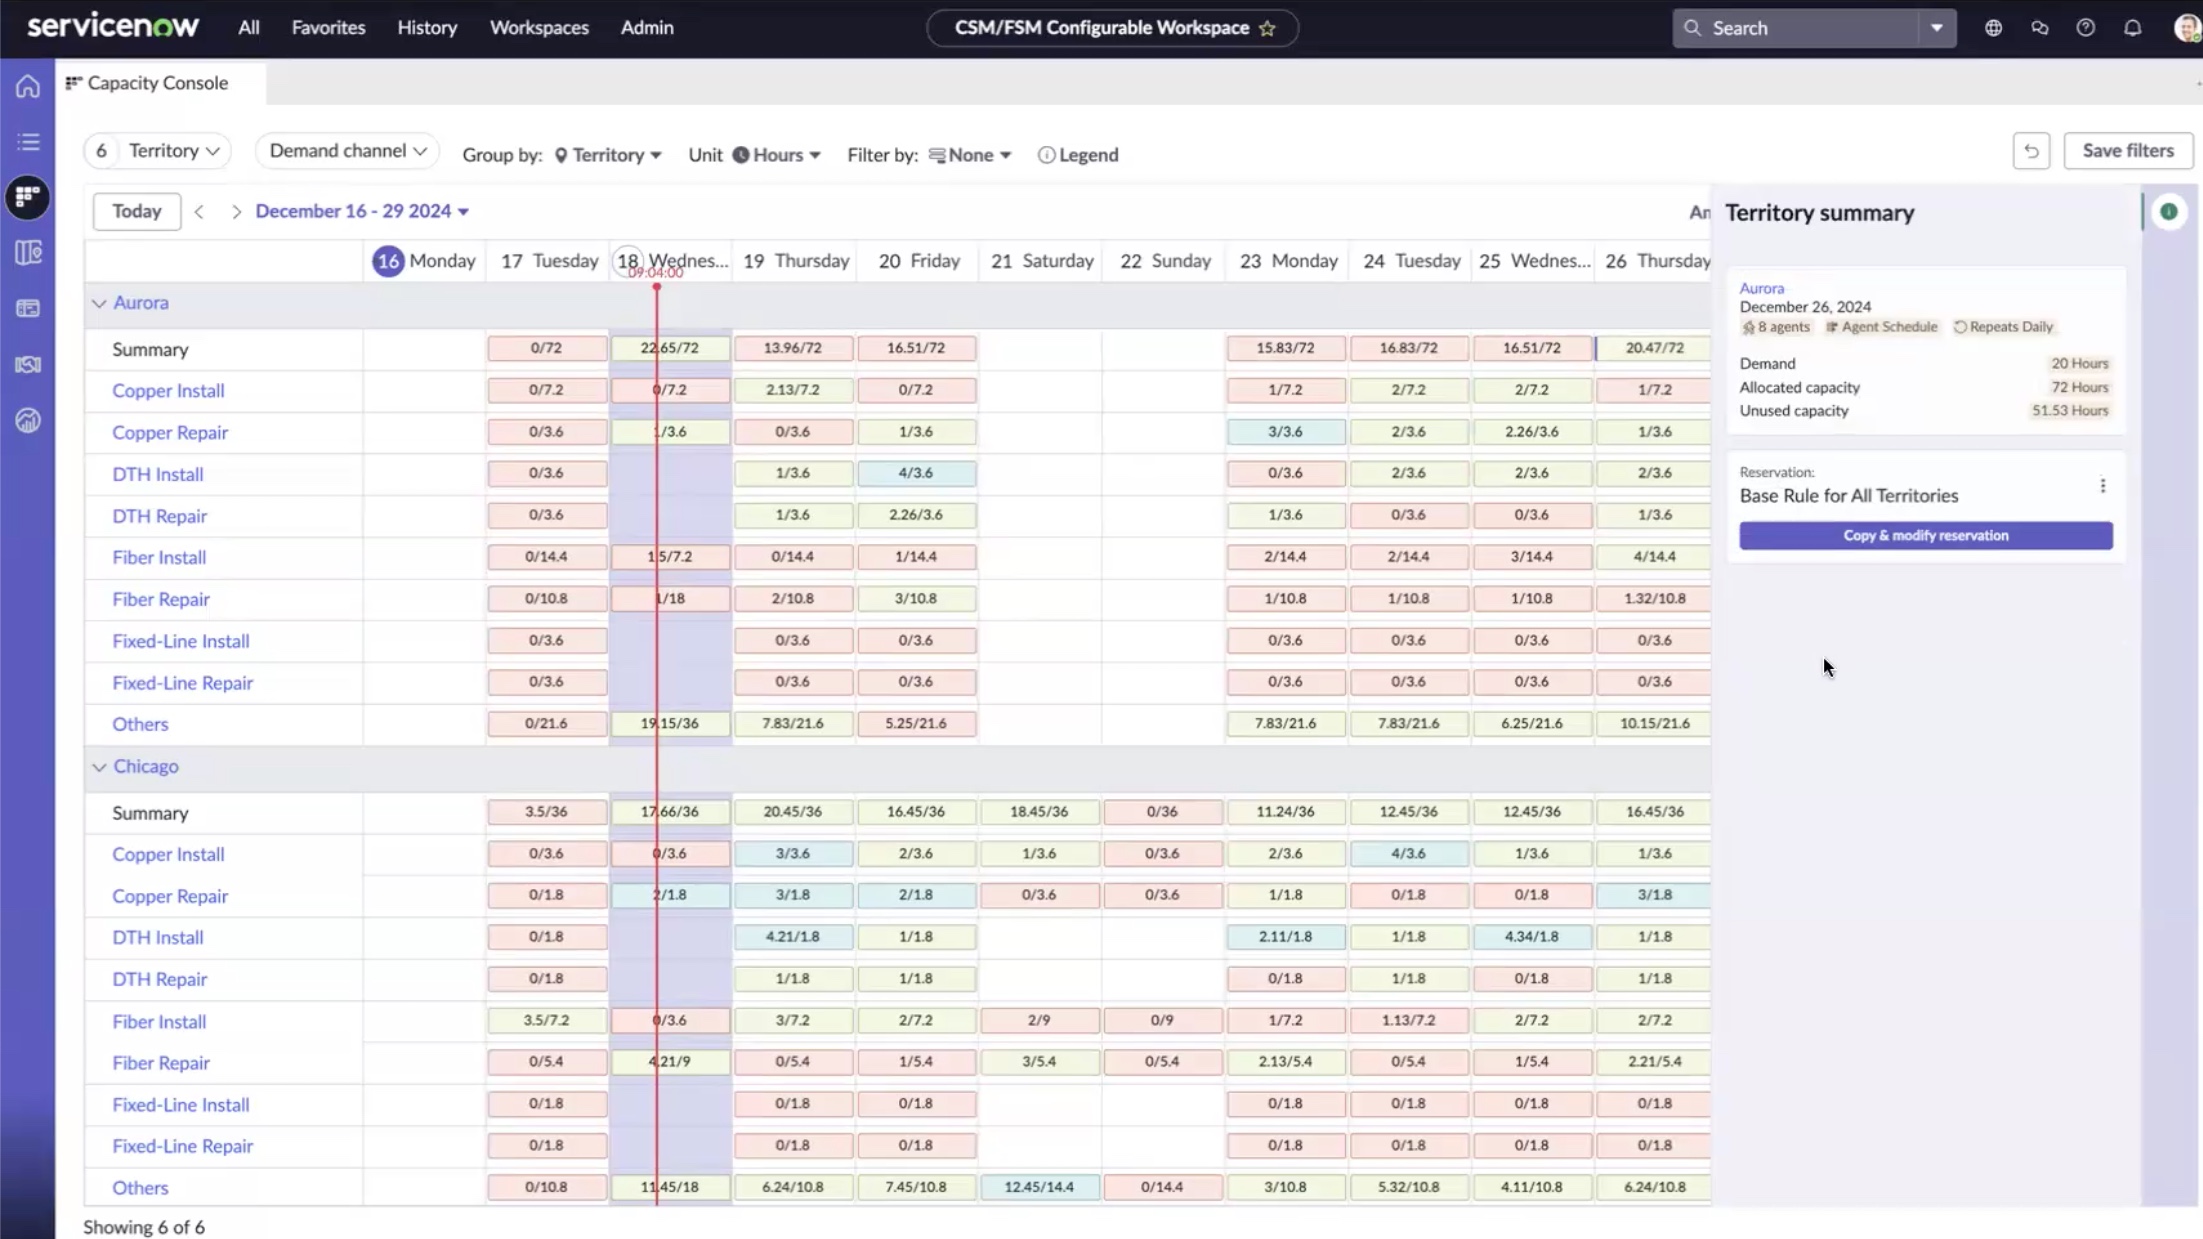
- Territories (for example, Aurora and Chicago).
- Demand channels (for example, Copper Install and Copper Repair).
- Weekly capacity metrics, including demand, allocated capacity, and unused capacity.