Edit a data visualization in an inline dashboard
You can create and edit a data visualization from within the inline dashboard editor. Not all the options are the same as in the Visualization Designer. You can move between the inline editor and the Visualization Designer.
You can add a data visualization to a dashboard through the Add new element menu, as described in Edit Platform Analytics dashboard elements. You can edit a visualization in the dashboard by putting the dashboard in edit mode and selecting the visualization. However, some of the behavior may differ:
- If the visualization is in the library and you own it, you need the itil, report_user, or viz_creator role to edit it. When you save your edit, you have the option to save the visualization in the library, which affects all dashboards that show the visualization, or to save a local copy only for the dashboard.
- If the visualization is in the library and you do not own it, you need the viz_admin or admin role to edit it. When you save your edit, you have the option to save the visualization in the library, which affects all dashboards that show the visualization, or to save a local copy.
- If the visualization is in the library and you don't have the necessary roles to edit it, you can "unlink" the visualization by creating a local copy, which you can edit. For more information, see Unlink a dashboard copy of a data visualization from the library.
- Some options may differ between the inline editor and the Visualization Designer. For example, in the chart interactions, you can set up a chart to drill down to another chart only in the Visualization Designer.
Important:
You cannot place Core UI reports or Performance Analytics widgets on a Platform Analytics dashboard. Add data visualizations instead.
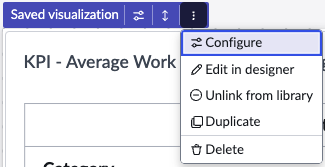
The Actions menu on the visualization itself provides options for changing the editor. You can also select to Configure the visualization, Duplicate the
visualization on the dashboard, or Delete the visualization from the dashboard.