In visualizations of data from the Task [task] hierarchy of tables, you can use questions defined for the table to filter or group the data.
Before you begin
Role required: viz_creator or higher, including itil. To see the data, you need a role permitted by a report_view access control on the data source table
About this task
Use a question as a filter, a group by, or an alternative group by.
Note: Box, and Trendbox visualizations can’t use questions as a group by or alternative group by. Single Score, Calendar Report, and Geomap visualizations don’t support grouping on any fields. Simple lists can use questions only as
columns. Pivot Table visualizations can group by questions only as columns or rows.
Procedure
-
Navigate to and open the visualization to add the question to.
-
Select one of the following options.
| Option | Description |
|---|
| Use the question as a filter |
Add or edit a data source and select Add custom conditions. If any custom conditions have already been defined, select + Add. Then select
Questions at the bottom of the field list. |
| Add the question as a column in a Simple List |
Under Default display, select + Add next to Columns. Then select Questions at the bottom of the field list. |
| Add the question as a group by
|
Under Group by, select + Add. Then select Questions at the bottom of the field list. |
| Add the question as an alternative group by |
Under Group by, select Add alternative group by. Then select Questions. |
| Add the question as a column or row in a pivot table |
Under Group by, select +Add for Columns or Rows, then select Questions at the bottom of the field list.Note:
- If you create the report with the question as the main Group By, the question behaves as an inner join.
- If you create the report with a regular field for primary grouping, and a secondary grouping on the question, the question works as an outer join.
|
The available questions appear. Not all questions that are available as group by values are also available as alternative group by values.
-
Select the question you want.
-
If you are using the question in a custom condition, select the operator and the value.
-
Select Apply.
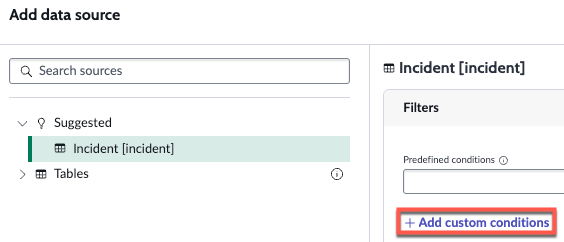
Question as a filter
Here you have opened the Edit data source page for a data visualization. No custom conditions have been defined for this data visualization, so you select
Add custom condition.
Next, you scroll down the Select field list to question, select that, and select a question.
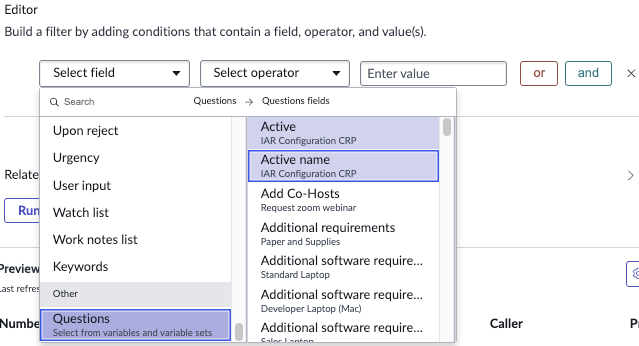
Finally you select the operator and the value, such as Is | A4, and select Apply.
Question as a column in a simple list
Here you have a simple list showing records on the Incident table. You want to add a column for one of the questions. So, first you select
+ Add next to Columns under the Default display settings.

The Choose a field pane opens. You scroll to the bottom and select
Questions.
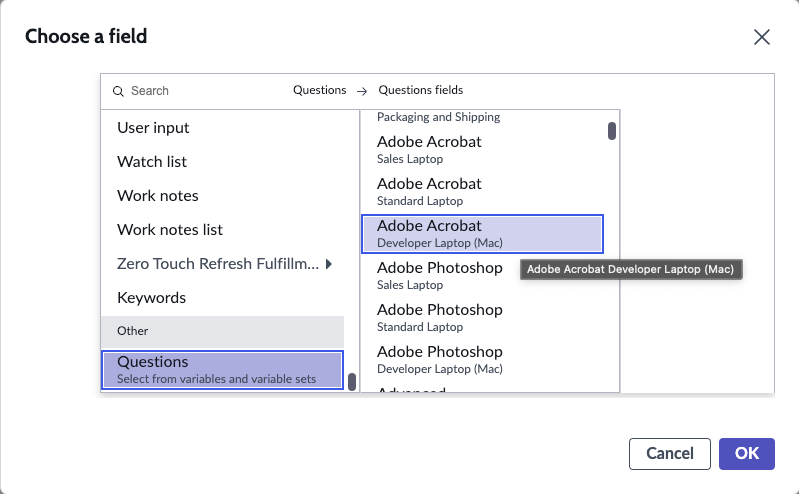
You select the question you want, such as Adobe Acrobat for a developer laptop, then press OK.
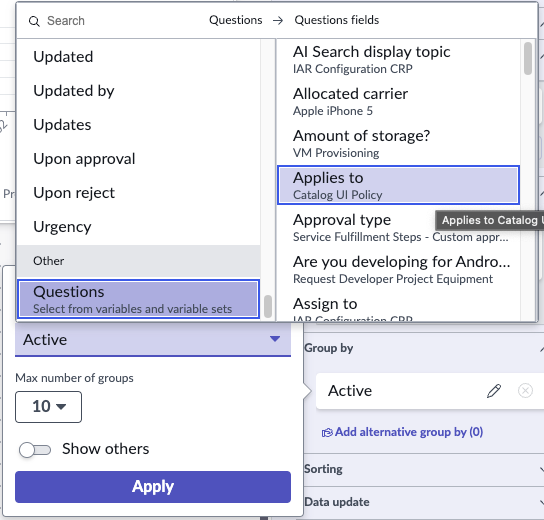
Question as a group by
In this case, you have a horizontal bar visualization of data in the Incident table. In the Group by section, you edit the group by. You scroll to the bottom of the list of fields and replace the Active field with questions, and
select your question.
If you want to add a question as a row or column on a Pivot Table, the experience is almost identical.
Question as an alternative group by
You want a different question as an alternative group by. You select
Add alternative group by and scroll to
Questions. Unlike other menus, its position is alphabetical instead of at
the bottom. You expand
Questions, and the list changes to a selection of questions. Not all questions that were available as a group by are available as an alternative group by. Anyway, you select some
questions and press
Apply all.
