Report types
Learn about the different types of reports that you can create, and when and how to create them.
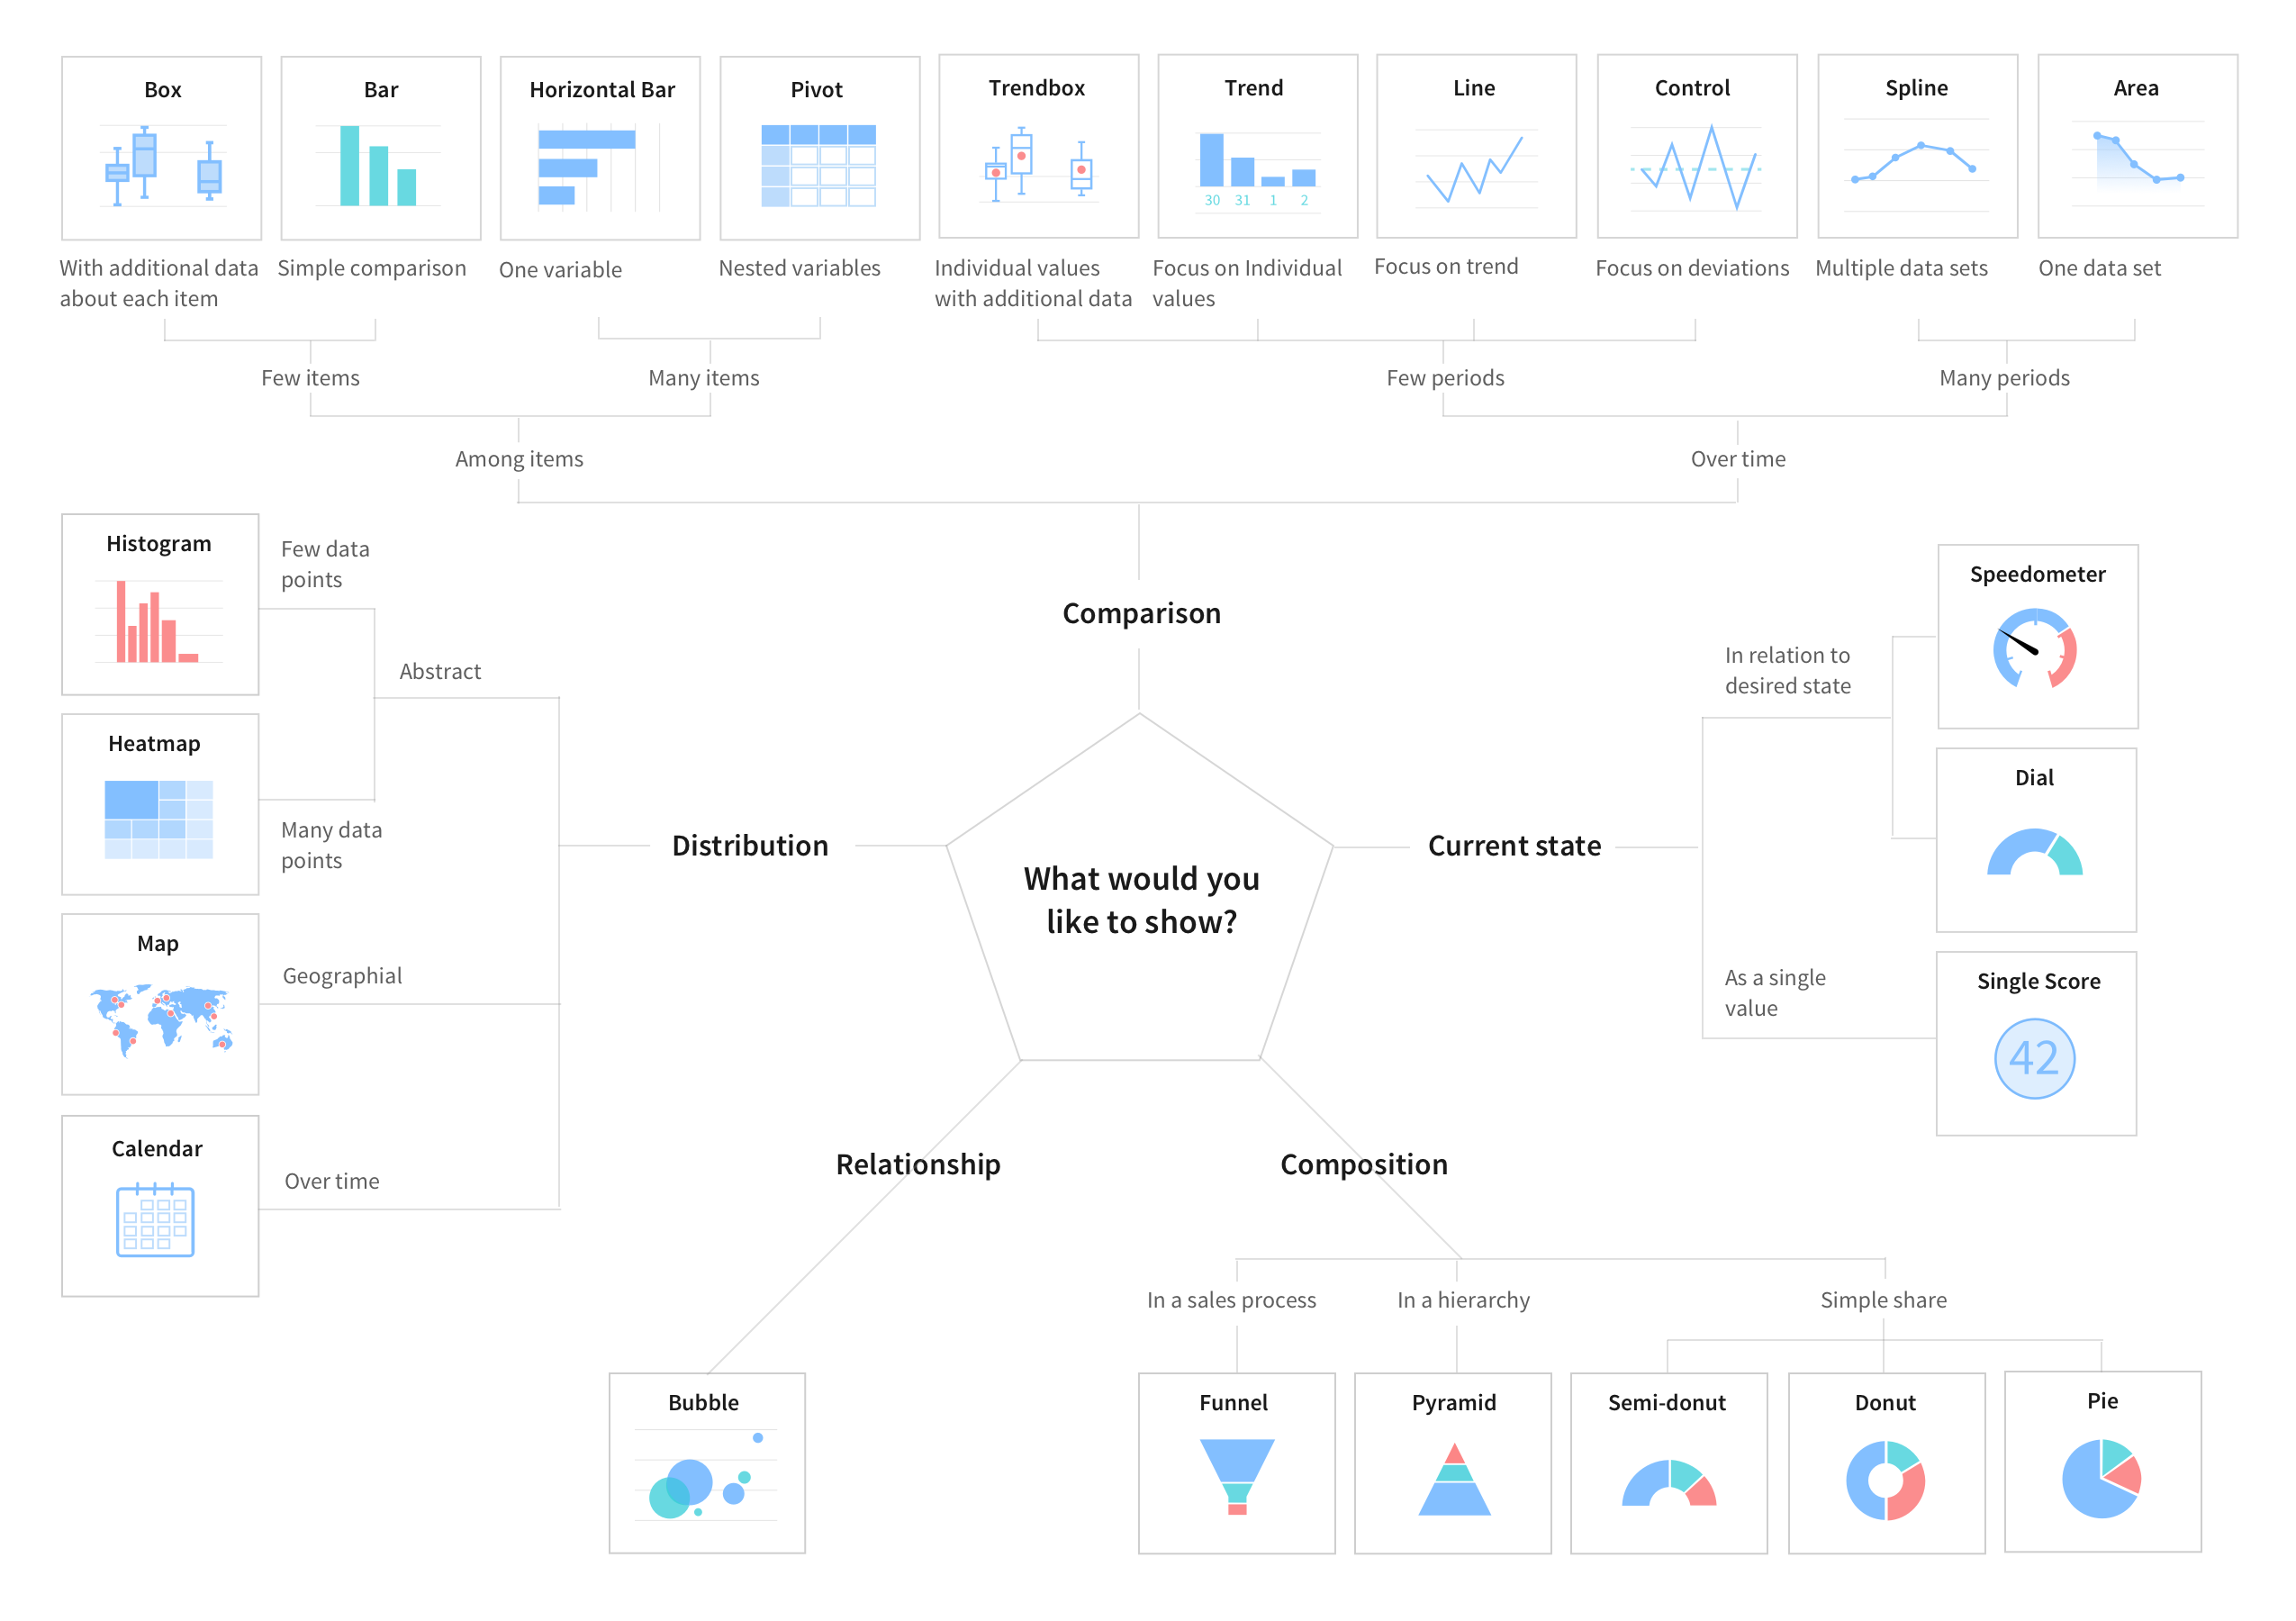
You can generate the following types of reports, organized by category:
- Bar reports enable you to compare scores across data dimensions.
- Pie and Donut reports visualize the relationship between the parts and the whole of a data set using a single round shape.
- Time Series reports visualize data over time. In addition to data from within your instances and imported data sources, you can also use MetricBase data in time series reports. For more information, see MetricBase application.
- Multidimensional reports visualize data across dimensions in a single table or graph.
- Scores visualize single data points either across ranges or as a single value.
- Statistical reports visualize data with statistical values such as medians and means.
- Other reports include calendars, maps, and lists.
You can also use Natural Language Query (NLQ) inside Report Designer to generate a report. Simply write a question into the NLQ field, and the Report Designer generates a report of an appropriate type.
| Report | Description | |
|---|---|---|

|
Vertical and horizontal bar reports | Shows vertical or horizontal bars with lengths proportional to the values that they represent. |
 |
Pareto reports | Combines bar and line reports to identify the most important factors in a large set of factors. |
 |
Histogram reports | Provides visual interpretation of numerical data by indicating the number of data points that lie within a range of values. |

| Report | Description | |
|---|---|---|
 |
Pie charts | Shows how individual pieces of data relate to the whole using a circle to represent the whole. |
 |
Donut reports | Shows how individual pieces of data relate to the whole using a donut shape to represent the whole. |
 |
Semi-donut reports | Shows how individual pieces of data relate to the whole using a semi-donut shape to represent the whole. A semi-donut report uses a donut sliced in half to represent the whole. |
| Report | Description | |
|---|---|---|
 |
Column reports | Shows how one or more values change over time by displaying them as proportional vertical columns. |
 |
Line reports | Shows how one or more values change over time by connecting a series of data points with straight lines. |
 |
Step line reports | Shows how one or more values change over time by connecting a series of data points with horizontal and vertical lines. |
 |
Area reports | Resembles a line chart, but the area between the axis and line is commonly emphasized with colors. |
 |
Spline reports | Shows how one or more values change over time by connecting a series of data points with a fitted curve through the data points. Spline reports let you take a limited set of known data points and approximate intervening values. |
| Report | Description | |
|---|---|---|
 |
Multilevel pivot tables | Displays aggregate data broken down by multiple metrics in a single chart. |
 |
Heatmap reports | Displays aggregate data in a matrix using colors to represent different values. |
 |
Bubble reports | Displays multiple metrics on a single chart. |
| Report | Description | |
|---|---|---|
 |
Speedometer reports | Shows an overview of the count of an indicator at the current moment in the form of a round meter. |
 |
Dial reports | Shows an overview of the count of an indicator that you want to measure in a half circle. The part in which scores are shown is filled with a color. |
 |
Single score report | Displays a single aggregate value that is important to your business. |
| Report | Description | |
|---|---|---|
 |
Control reports | Displays data as a series of connected points to determine whether a business process is in a state of statistical control and to identify outliers. (Found in the Other reports section.) |
 |
Trend reports | Shows how the value of one or more items changes over time. Values along the horizontal axis of the trend report represent the time measurement. Values on the vertical axis represent the changes to the items being monitored. The trend line or curve reveals a general pattern of change. (Found in the Other reports section.) |
 |
Box reports | Shows the distribution of values in a data set highlighting statistical averages. (Found in the Other reports section.) |
|
Trendbox reports | Shows the distribution of values in a data set highlighting statistical averages for a specified periodof. (Found in the Other reports section.) |
| Report | Description | |
|---|---|---|
 |
Funnel reports | Displays values as progressively decreasing proportions. The size each section reflects a percentage of the total of all values. |
 |
List reports | Displays data in the form of an expandable list, similar to a standard ServiceNow list component. |
 |
Calendar reports | Displays data-driven events in a calendar format. |
 |
Map reports | Displays data on a geographical map image. |
 |
Pivot tables | Aggregates data from a table to display the source of summarized data. This functionality is expanded in multilevel pivot reports. |
 |
Pyramid reports | Visualizes a variation on a bar report using pyramid sections instead of rectangles. (Found in the Other reports section.) |
Choosing a report type
Choose a report type based on the story that you want data to tell.