Following filters per metric
If you are showing multiple metrics in a horizontal or vertical bar visualization, you can have filters on a dashboard apply only to specific metrics.
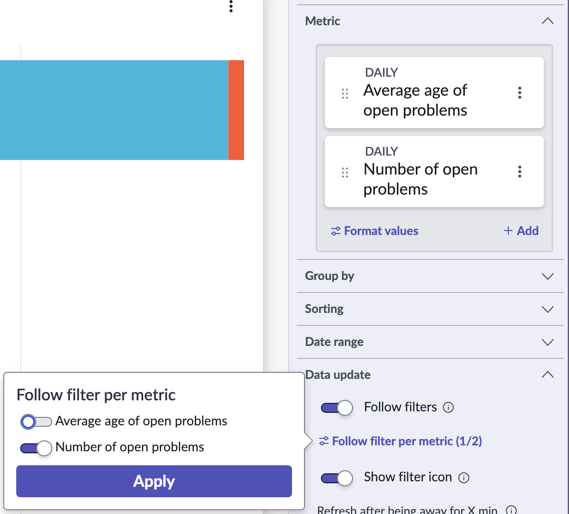
If Follow filters is activated on a time series or bar visualization that shows multiple metrics, the configuration panel shows an expandable item called Follow filters per metric. Expand this item to toggle filter following on or off for each metric.
For example, consider a bar visualization that shows the Number of open problems and the Average age of open problems. You can configure this visualization so that the Number of open problems follows any
applicable filters on a dashboard, but the Average age of problems does not.