Create a Data snapshots automated indicator
To analyze the performance of a business process that is recorded in a ServiceNow table, use an automated indicator. If you have Data snapshots enabled on your instance, you can create a Data snapshots automated indicator.
시작하기 전에
Determine whether your use case meets the following requirements:
- Your license enables you to create indicators.
- You have Data snapshots enabled on your instance. For more information, see Activate Data snapshots.
- You have a suitable Data snapshots source. For more information, see Data snapshots sources and collection.
- You don’t need to apply a scripted breakdown, such as an Age bucket group, or a scripted aggregate to the indicator. If you need such a breakdown or aggregate, create a classic indicator instead. For more information, see Create an automated indicator.
Role required: pa_power_user or higher
프로시저
-
If you selected Create indicator from the indicator library, select the Automated indicator type and Data snapshots source type.
-
In the Source field, select from the existing Data snapshots sources.
If there are no sources, or none of the sources are suitable, select New. Follow the procedure in Create a Data snapshots source.
When you select a source, the fact table field is automatically populated and read-only. The available calendars are populated, and if the source supports only one calendar, this field is read-only.
Simple daily count indicator
Here you have an automated Data snapshots indicator built on a source with a daily frequency.
Note the following points:
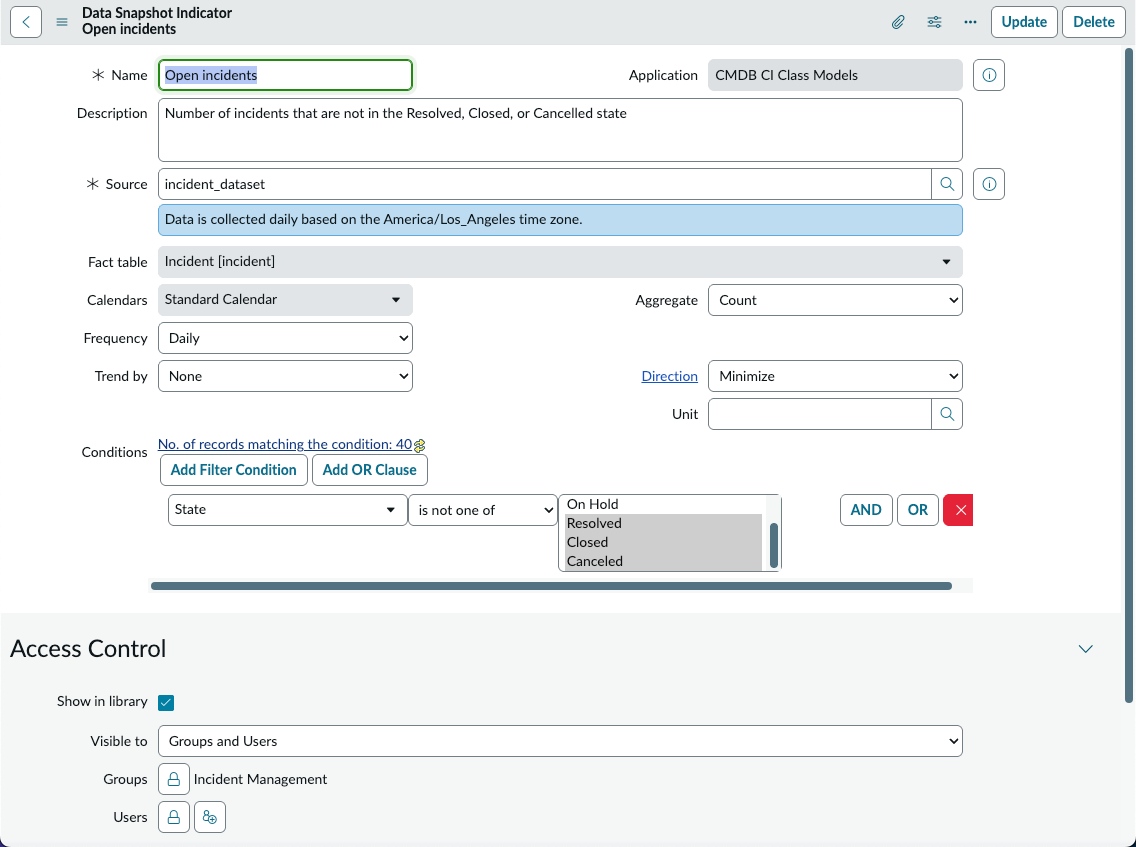
- The application scope is CMDB CI Class Models. This scope was selected before any work began to create the indicator, to match the application scope of the Data snapshots source. By implication, you should investigate the Data snapshots sources before you create an indicator.
- The source is incident_dataset. You see that the fact table for this source is Incident [incident]. The source has only one calendar, the Standard Calendar, and it has the Daily frequency.
- No Trend by field is selected and the aggregate is Count. Therefore, the indicator score is the total number of open incidents on each day that data is collected, regardless of when the incidents became open.
- The direction is Minimize, because you want this number to go down.
- The conditions define which incidents are Open; namely, those indicators whose States aren’t Resolved, Closed, or Canceled.
- The Access Control section shows that the indicator is displayed in the indicator library and KPI Details. You also see that viewing rights are restricted to users in the Incident Management group.
Intraday indicator
Here you have an indicator whose source is based on an intraday calendar. Intraday indicators can be created only from sources where the Data frequency is All Activity.
Note the following points:
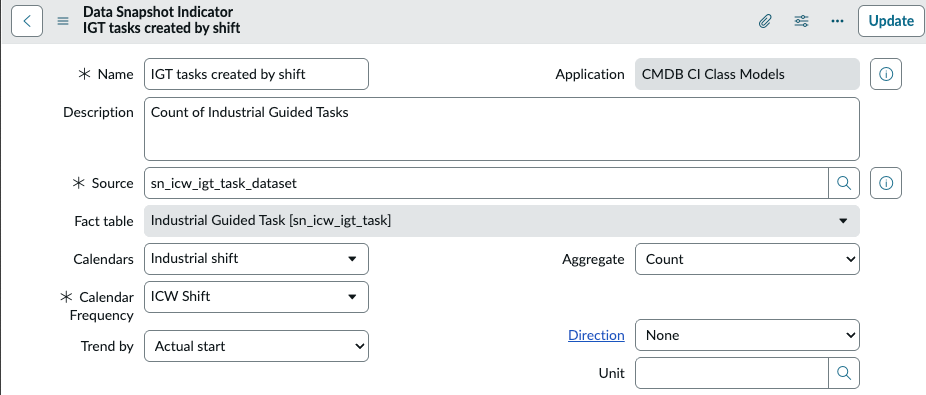
- The application scope is CMDB CI Class Models. This scope was selected before any work began to create the indicator, to match the application scope of the Data snapshots source. By implication, you must investigate the Data snapshots sources before you create an indicator.
- The source is sn_icw_igt_task_dataset. You see that the fact table for this source is Industrial Guided Task [sn_icw_igt_task]. This source supports both the standard calendar and several business calendars. You want a calendar that supports intraday factory shifts, so you choose the Industrial shift calendar. Then you choose the Calendar Frequency that supports shifts, ICW Shift.
- The aggregate is Count and the Trend by field is Actual start. As a result, the indicator counts the number of Industrial Guided Tasks that are created on each shift.
Effect of Trend by field
In the Intraday indicator example, you had an indicator that used the Actual shift field for trending. The resulting scores are the number of Industrial Guided Tasks (IGT) that are created on each shift.
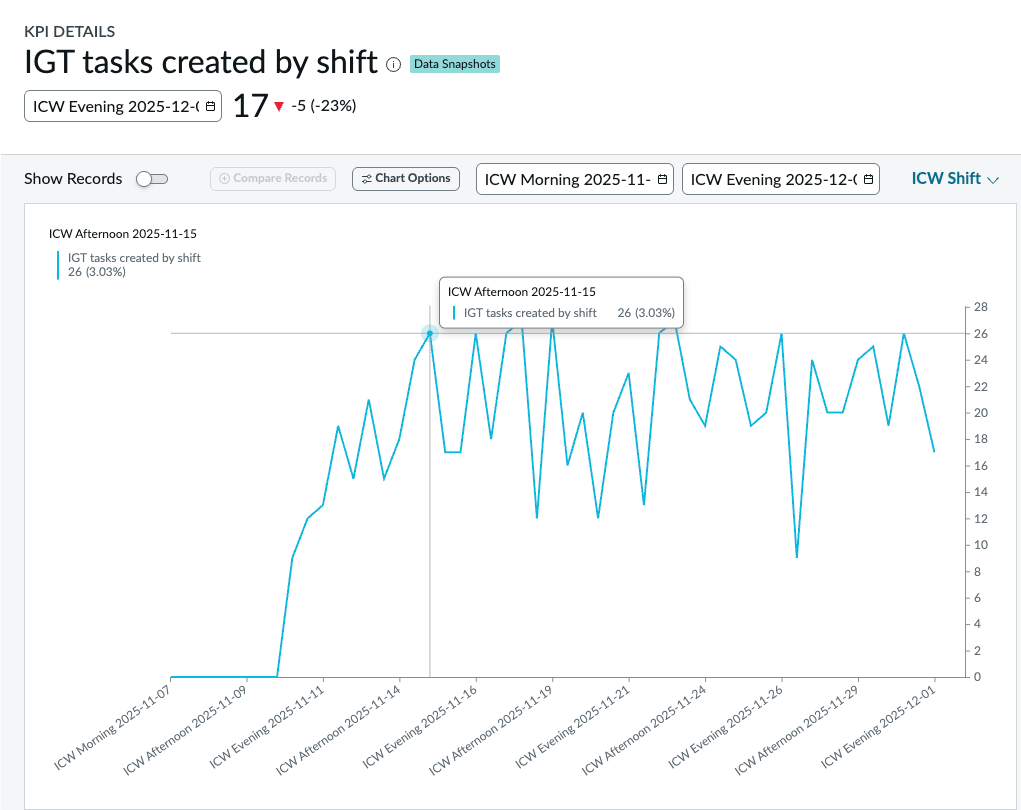
If no Trend by field is selected, the data doesn’t show IGT tasks created by each shift. Instead, the data shows the cumulative number of IGT tasks created over the chart time period.
