You can add reports to forms such as change requests, and configure the report
visualizations to display information relevant to the user of the form. The configuration is
specific to the current view.
Before you begin
Role required: itil, report_user, report_group, report_global, report_admin, or admin. To create a meaningful report, you must have the right to access the data you want to report on.
The following report types are not supported on forms: List, Pivot, Multilevel Pivot,
Calendar, and Single Score.
Procedure
-
Select the table on which you want to configure a form with a report in the
Filter navigator and select a record.
For example,
select a record from task.list.
-
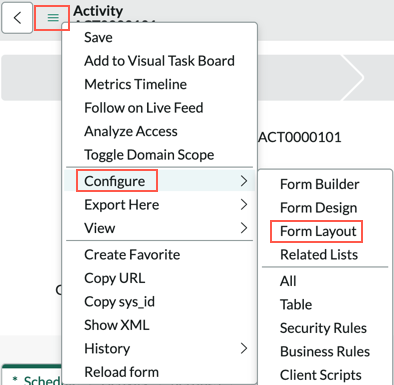
From the context menu (
 ), select .
-
From the Available list, add *Chart to the Selected column.
Use the up and down arrows to position the report on the form.

- Optional:
Specify a label for the chart.
This option appears when you select the up or down arrow to specify the report's place on the form. The label appears next to the report in the form. If you do not specify a label, the label New Chart is used.
-
Select Save.
The text Configure chart appears on the form in the specified position.
-
Select Configure chart.
-
Select the search icon (
 ) to select a report.
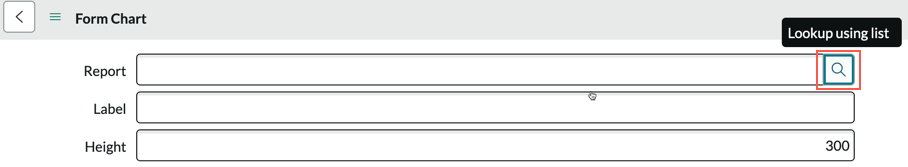
- Optional:
Specify the height of the chart.
The default value is 300 pixels.
- Optional:
You can filter the data in the report based on selected fields or based on a
scripted filter or an encoded query.
The first field must be visible on the form. To add fields to the form, select move the field from the
Available column to
Selected.
On the Report condition extension tab, select the form field on which the report is
updated and the field on the report source table to which the form field is compared.
To specify a scripted filter or an encoded query, select Advanced condition Extension and paste the script in the Report Qual text box. Advanced condition extensions, if
present, override report condition extensions.
-
Select Update.
-
To change the configuration, right click on the label and select
Configure chart.
Result
The selected report appears on all forms which are of the same type as the one
selected. These reports are filtered based on the report condition extensions.