Auto Query page
Summarize
Summarized using AI
This content was generated using new OpenAI-powered functionality. Results are provided on an as is basis and are not guaranteed to be accurate or complete.
Summary of Auto Query page
The Auto Query page in the Discovery Console for OT enables users to manage and view automatic asset queries. This page displays a comprehensive list of available queries, providing essential information about each one, including its status and execution details.
Show less
Key Features
- Query Information: Each query is listed with key attributes such as Name, Enabled status, Status icon, Sensors involved, Recurring schedule, and execution history.
- Actions Menu: Users can toggle detail columns to show additional data, select multiple queries for batch actions like deletion, or create default auto queries.
- Default Auto Queries: Five standard queries are available, including Console Hostname Lookup, Asset ICS Discovery, Location Set, SNMP, and OS Detection, each serving specific asset discovery functions.
- Quick Scans: Users can initiate Quick Scans, which are designed to run swiftly and are limited to a single execution, targeting assets via URLs, IP addresses, or ranges.
Key Outcomes
Utilizing the Auto Query page allows ServiceNow customers to efficiently manage asset discovery, streamline query execution, and ensure that their systems remain updated with accurate asset information. The ability to create and customize queries enhances operational effectiveness and facilitates better resource management.
The Auto Query page contains the automatic asset queries for the Discovery Console for OT.
Auto Query
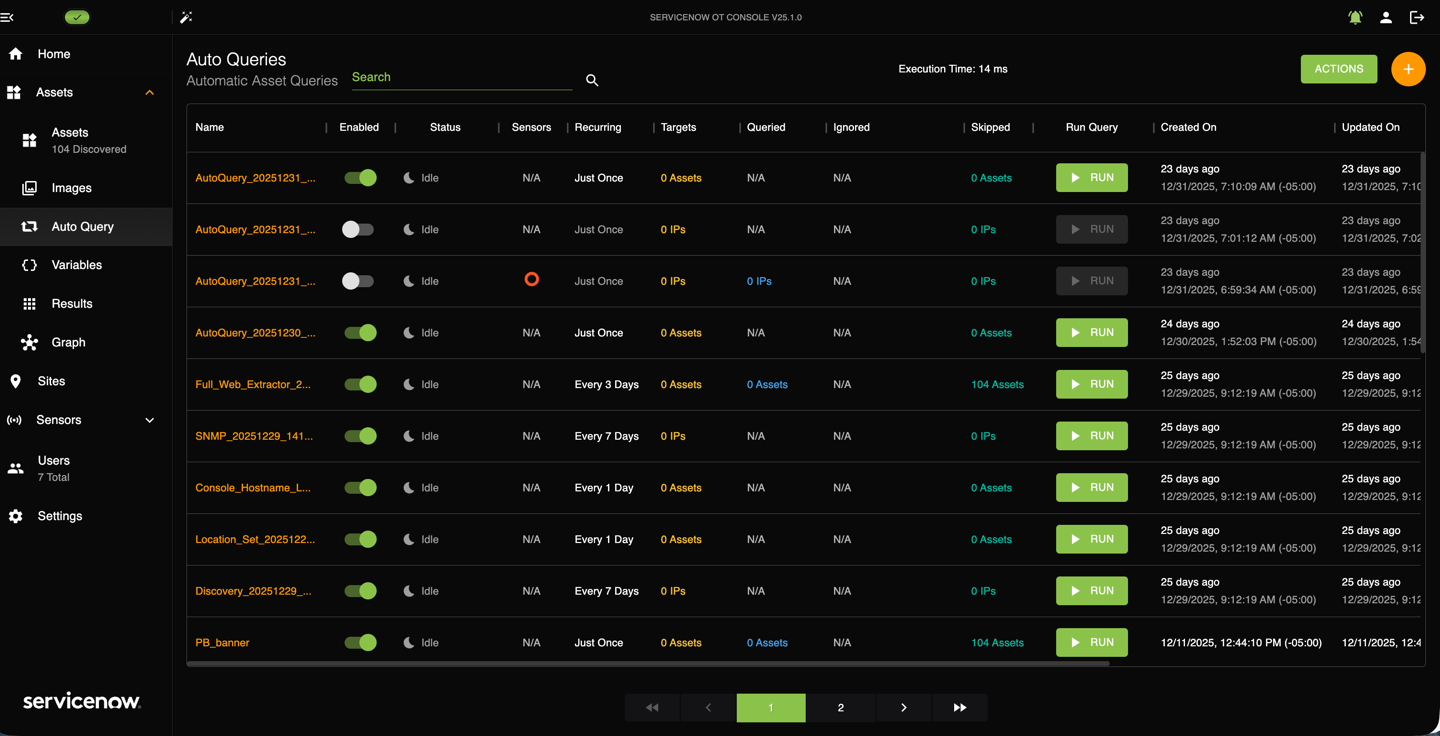
The Auto Query page contains a list of all the automatic asset queries available for your system. Each Auto Query is displayed in columns with the following headings and information.
- Name
- Enabled
- Status
- Sensors
- Recurring
- Targets
- Queried
- Ignored
- Skipped
- Run Query
- Created On
- Updated On
- Last Executed On
- Completed
- Delete
The following image shows an example of the Auto Query page.
Note:
When a query is enabled but not running, the Status column displays idle icon  to indicate it is idle. When related or all Sensors are offline, the All Sensors Offline icon
  displays.
to indicate it is idle. When related or all Sensors are offline, the All Sensors Offline icon displays.Actions
The Actions button is a drop-down menu that includes the following options.

- Show Detail Columns: Toggles between Show and Hide. When showing the Detail Columns, additional columns display on the page. The additional columns shown include:
- Run Count
- Last Run Started
- Last Run Ended
- Next Scheduled Run
- Current Sites
- Last Delay
- Exec Time
- Select Multiple: Opens check boxes by each query in the list. You can check a box and the Delete Selected option is activated. This option deletes the selected queries. To turn off
this option, select the Actions button again and select Cancel Select Multiple.
- Create Default Auto Queries: There are 5 default queries to choose from. Selecting this option opens the Create Auto Queries window. Select from the following default auto queries:
- Console Hostname Lookup: Reverses the DNS look up performed by Console.
- Asset ICS Discovery: Finds the ICS assets based on common open ports and queries using native protocols.
- Location Set: Sets a label and a location field using the Site name.
- SNMP: Queries to discover SNMP service. This tries only the SNMP port.
- OS Detection: Use with caution, especially in production environments. This query can disrupt or crash poorly configured or sensitive assets. Queries Linux / Windows endpoint for any discoverable services.
- Quick Scans: When selected, this selection displays a list of any current Quick Scans. You can create a Quick Scan by selecting the add icon
 . Set the parameters of the Quick Scan in the Create Quick Scan page. Quick Scans are meant to run quickly and only once. Quick Scan targets can be assets selected by their URLs, IP Addresses, or IP ranges. See Create a Quick Scan for more information on Quick Scans.