Chart options for multiple metrics
If you are showing multiple metrics in a time series data visualization, you can set the visualization type and the Y-axis scale for each metric.
When you have a data visualization with more than one data source, you have a separate metric for each data source. To make the resulting chart easier to understand, you can select a separate chart type for each metric. In each Metric
tile, selecting the chart icon opens a list of chart types to choose from.
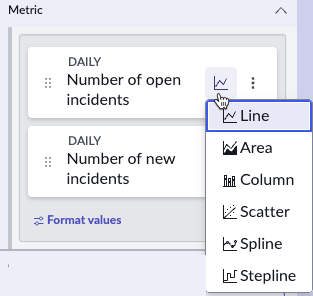
In some cases, the difference between the range of values of metrics makes it difficult to read the metrics when they share the same Y-axis scale. In this case, you can have separate Y-axis scales for the metric. Add a Y-axis for a
metric by selecting the More options icon in the metric tile. Be sparing with this function, however, because having too many Y-axis scales also makes the chart difficult to read. Also, be sure to give a short but clear label for each
Y-axis if you have more than one.
