Viewing metrics and activity transitions
View metrics and activity transitions you have defined.
View metrics
View your selected metrics, or the full list of metrics for an activity or connection. The
metrics box ( ) on a route shows the primary and secondary metrics selected to show on the process
map.
) on a route shows the primary and secondary metrics selected to show on the process
map.
Select an activity or connection to see a full list of metrics.
Viewing activity transitions
View activity transitions you've defined from the Bottleneck Analysis feature.
Expand the Bottleneck Analysis box to see the top five overall and specified activity state
transitions across these specific metrics.
- Unique Occurrences
- Maximum Repeat Occurrences
- Average Duration
- Total Duration
- Total Occurrences
Select a transition link from the list to edit activities for the selected filter.
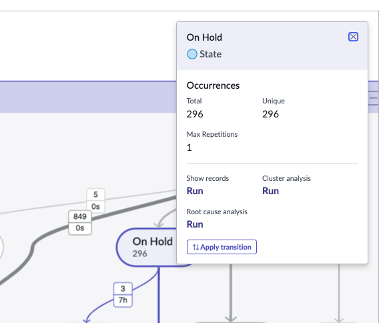
Viewing records for an activity or connection
See the list of records which passed through an activity or connection to analyze data in more detail.
Select an activity or connection on a route to display the metrics box. You can then also select Show Records to open the list of records that passed through it.
Note:
The Show Records
link displays for a maximum of 100,000 records returned for an activity or connection. An administrator can add and the promin.show_records.limit system property to change this limit. The sn_process_optimization_analyst role
must have read access to the promin.show_records.limit system property. For instructions on adding properties, see Add a system property.