Configure visualization interactions
Select what happens when a viewer interacts with a section of a data visualization that you are editing.
Before you begin
Role required: You can configure this option on any visualization you create, but the person viewing the data visualization must have the right to see the underlying data.
About this task
You can configure chart interactions only in the Visualization Designer or the inline dashboard editor, not in UI Builder.
Procedure
-
Under Action, select from the available chart interactions.
The possible interactions are:
- Go to data view
- Go to URL
- Drill down to chart (available from within the Visualization Designer): Lets you add multiple layers of visualizations to drill down to from each metric in the visualization.
- Apply as filter (available only when editing within a dashboard)
Drill down to chart
Consider a horizontal bar data visualization of the number of incidents on the Incident table grouped by Priority. You decide that users should drill down from a value on this visualization to a single-score visualization showing the total
number of incidents.
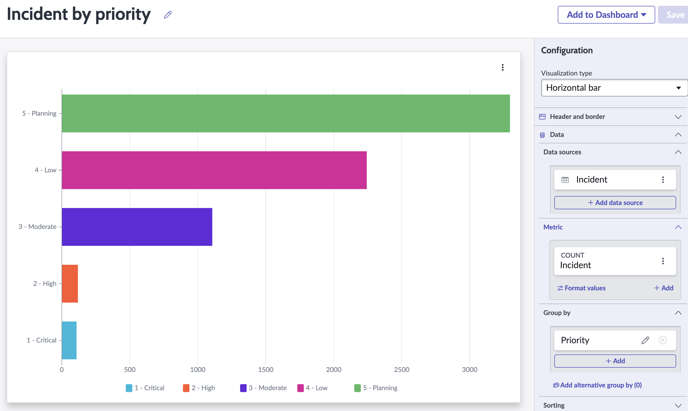
- You navigate to the Chart interaction section of the configuration panel. Here you select Drill down to chart as the action. You can add a drilldown chart to any of the metrics in the
visualization. As the Incident metric is the only one on the visualization, this metric is your only choice.
- You select + Add drilldown for the Incident metric. A configuration panel for a new visualization called Drill down 1 opens.
- You configure the visualization to show a single score representing the number of incident records on the Incident table and save the visualization.
- You could add another visualization to drill down to from the single score visualization that you created, but you don't think this is necessary.
- Now, when a viewer interacts with this visualization on a dashboard, they can drill down from the bar visualization to the single score and navigate back up. Similarly, you or another editor of the visualization can
move between the parent and child visualizations to edit the configuration of either one.