In data visualizations based on service catalog data, stack and group by variables, use variables as columns in lists, and as columns and rows in multilevel pivot tables.
Before you begin
Role required: viz_creator or higher, including itil. To see the data, you need a role permitted by a report_view access control on the data source table
Note:
- Users with a role other than viz_admin can use service catalog variables if as admin you add their role to the access control lists (ACLs) for the following tables: Options [sc_item_option], Variable Ownership
[sc_item_option_mtom], and Variables [item_option_new].
- The data source for the visualization must be based on the Requested Items table [sc_req_item] or the Catalog Task table [sc_task]. Using other types of variables causes an error when generating the data
visualization.
- The Oracle Database CLOB field doesn’t have the functionality to retrieve the variables data in data visualizations. For a column string field of less than 4000 bytes, you can change the column type to varchar2. To
compare the CLOB columns of a smaller size, use the to_char() function. For a larger size CLOB, you must get a substring for comparison using the dbms_lob.substr functions.
About this task
Use a variable as a filter, a group by, or an alternative group by.
Note: Box and Trendbox visualizations can’t use service catalog variables as a group by or alternative group by. Single Score, Calendar Report, and Geomap visualizations don’t support grouping on any fields. Pivot Table
visualizations can group by variables only as columns or rows.
Procedure
-
Navigate to and open the visualization to add the variable to.
-
Select one of the following options.
| Option | Description |
|---|
| Use the variable as a filter |
Add or edit a data source and select Add custom conditions. If any custom conditions have already been defined, select + Add. Then select
Variables at the bottom of the field list. |
| Add the variable as a group by
|
Under Group by, select + Add. Then select Variables at the bottom of the field list. |
| Add the variable as an alternative group by |
Under Group by, select Add alternative group by. Then select Variables at the bottom of the field list. A viewer can choose one of these
variables at runtime, as described in Select a group-by value in a data visualization as a viewer. |
| Add the variable as a column or row in a pivot table |
Under Group by, select +Add for Columns or Rows, then select Variables at the bottom of the field list.Note:
- If you create the report with the variable as the main Group By, the variable behaves as an inner join.
- If you create the report with a regular field for primary grouping, and a secondary grouping on the variable, the variable works as an outer join.
|
-
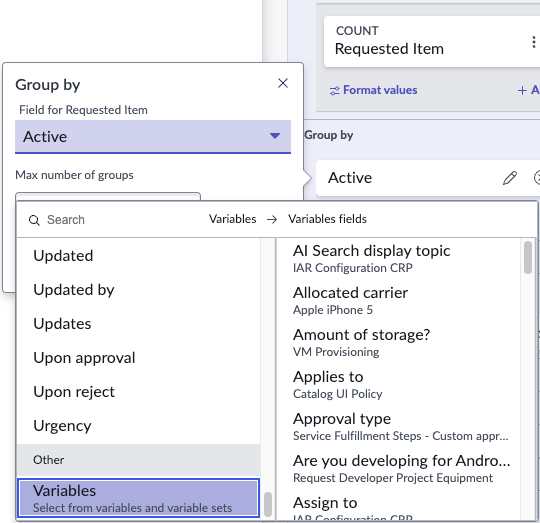
Scroll to the end of the list of fields and select Variables.
The available variables appear. Not all variables that are available as group by values are also available as alternative group by values.
-
Select the variable you want.
-
If you are using the service catalog variable as a filter, select the operator and the value.
-
Select Apply.
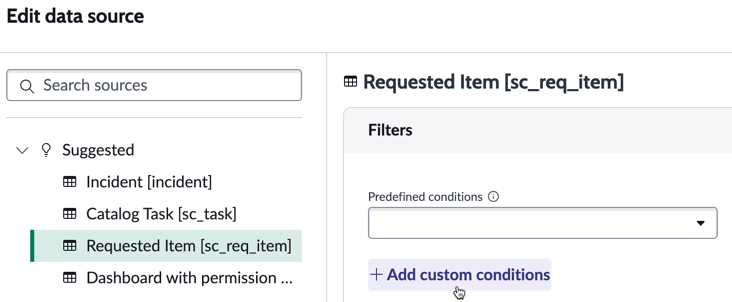
Variable as a filter
Here you have opened the Edit data source page for a data visualization. No custom conditions have been defined for this data visualization, so you select
Add custom condition.
Next, you scroll down the Select field list to Variable, select that, and select a variable.

Finally you select the operator and the value, such as Is | A4, and select Apply.
Variable as a group by
In this case, you have a horizontal bar visualization of data in the Requested Items table. In the Group by section, you edit the group by. You scroll to the bottom of the list of fields and replace the Active field with
Variables, and select your variable.
If you want to add a service catalog variable as a row or column on a Pivot Table, the experience is almost identical.
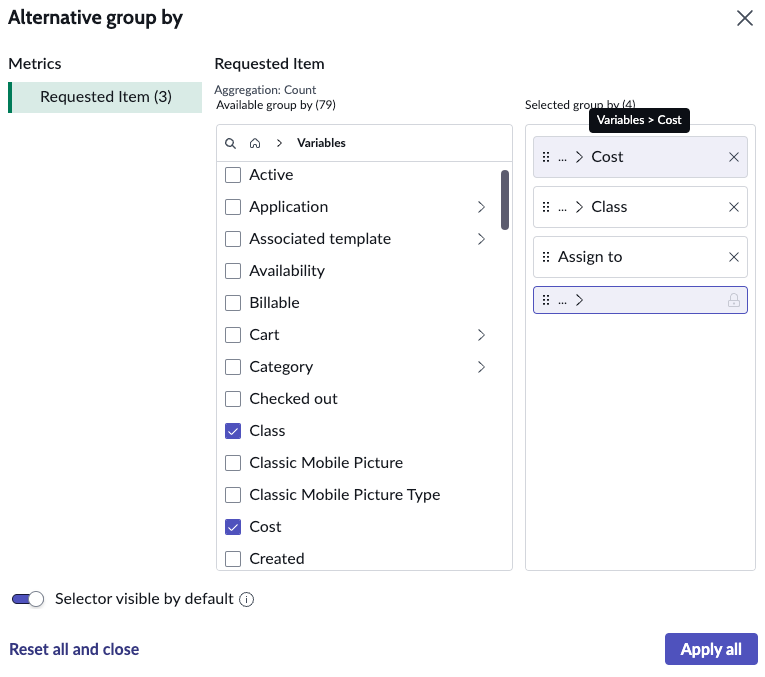
Variable as an alternative group by
You want a different service catalog variable as an alternative group by. You select
Add alternative group by and scroll to the bottom. You expand
Variables, and the list changes to
a selection of variables. Not all variables that were available as a group by are available as an alternative group by. Anyway, you select some variables and press
Apply all.