Navigating the Usage Insights application
Understand how to navigate the Usage Insights application, including the All Applications and individual application views.
Users with any Usage Insights viewer role can access the application by navigating to .
Different users have different rights and privileges in the Usage Insights application. For more information, see Roles installed with Usage Insights.
All Applications view
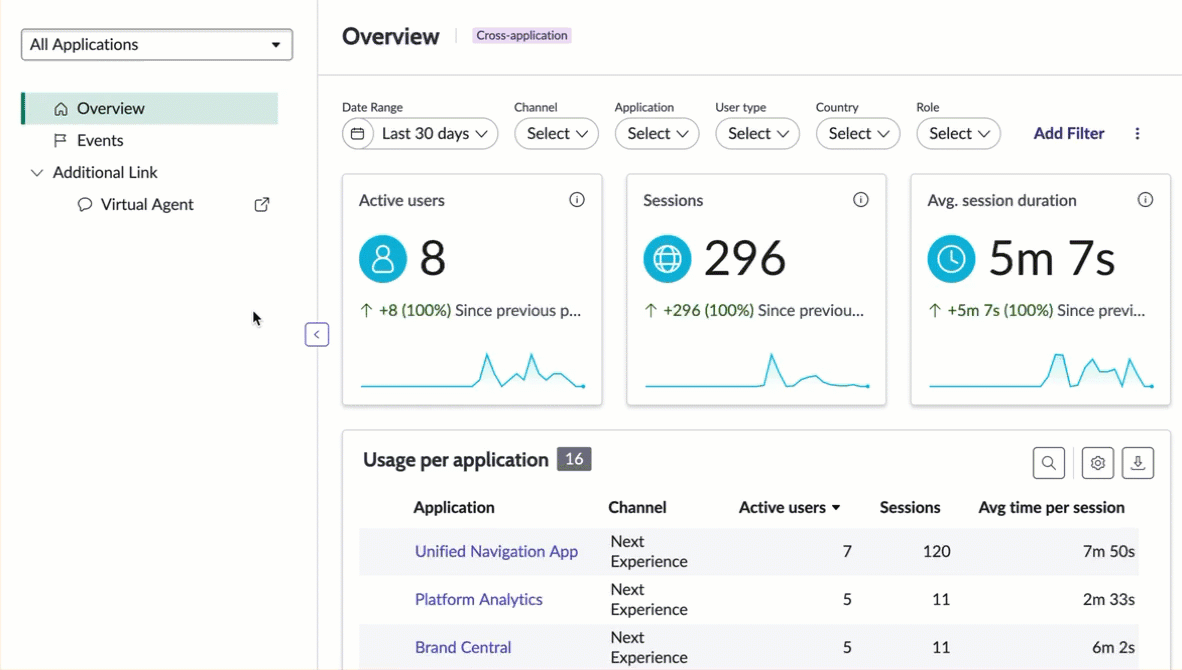
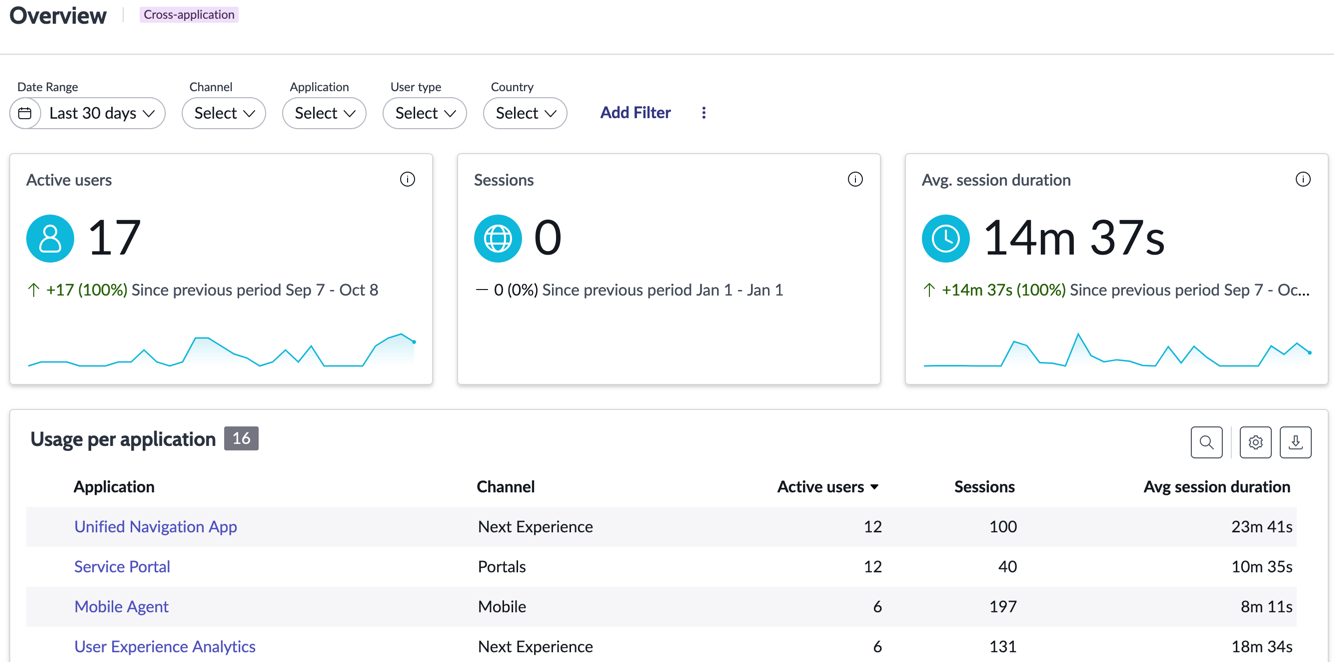
When you launch Usage Insights, there are two tabs: Overview and Events. The Overview tab allows you to view aggregate usage within a given time frame across all of your tracked applications. There are a number of
filters you can configure to see scores for Active users, Sessions, and Average session duration, as well as a list showing usage by individual application. The Events tab enables you to filter a list of tracked user
interactions across enabled Usage Insights applications.
Metrics across all applications
You can view basic application usage and event details for all applications within an instance. Select All Applications from the applications list to see these metrics simultaneously.
| KPI | Description |
|---|---|
| Total Active Users | Total number of users, including new users, whose first session occurred within the specified time period. |
| Sessions | Total number of sessions that have occurred, and average number of sessions per day. |
| Average Screens/Session | Average number of pages or screens viewed and actions performed per session. |
| Avg. Session Duration | Average time spent across sessions for all users. |
| Total Sessions | Total number of sessions performed daily, weekly, and monthly. |
| Users | Total number of daily, weekly, and monthly active and new users. |
| New / Returning Users | Percentage of users whose first session occurred within the specified time period, and percentage of those users who subsequently started a second session. |
| App Versions | App versions installed by users for the selected platform(s). |
| App Version Adoption | Shows session segmentation between different versions of the app. For example, if a new app version was released yesterday, and today shows 10% of all app sessions, the current adoption of the new app version is 10%. |
| Session Duration | Percentages of sessions segmented by their length/duration. |
| Hourly Usage | Average number of app launches that occurred at a specific hour of the day over all days. |
Individual application view
The individual application view has more detailed information for a specified application.
The Analysis menu items provide access to the Retention, Cohort analysis, Conversion funnel, and Navigation paths modules. The Data Foundation menu items provide access to the Users, Sessions, Events, and Pages
modules.
| Module | Description |
|---|---|
| Retention | Visualize new users and their rates of return and periods between visits. For more information, see User retention. |
| Cohort analysis | Create and analyze custom cohorts or groups of users separated from other users by similar traits or actions. Analyze how many users perform specific sequences of actions, and how often they return to perform specified actions over a given time. For more information, see Cohort analysis in Usage Insights. |
| Conversion funnel | Create funnel reports to analyze user completion rates for a specific task. View conversion rates, the number of users progressing from one step to the next and the average time for users to advance to each step and complete the funnel. For more information, see Funnel reports in Usage Insights. |
| Navigation paths | Visualize users' journeys through your application, discovering the most and least popular paths. For more information, see Navigation paths. |
| Module | |
|---|---|
| Users | A list of users that you can filter, drill down into, and export. |
| Sessions | A list of sessions that you can filter, drill down into, and export. |
| Events | A list of user interactions such as page navigation and clicks that you can filter, drill down into, and export. |
| Pages | A list of visited pages on your instance that you can filter, drill down into, and export. |
| Feature area | UI component | Description |
|---|---|---|
| 1 | Applications list | List of registered web and mobile applications. You can select from these views:
|
| 2 | Selected dashboard menu item | The Overview, Analysis, or Data Foundation item you've selected. In the example, Overview is selected. |
| 3 | Filters | Default filters you can use to limit the data, including Date Range, User type, and location. Use the Add Filter option to add more filters to the page. For more information, see Filter data in User Experience Analytics. |
| 4 | Total active users | Shows Active users, new users, and the average number of sessions per user. Select any visualization in this section to view the trend analysis for Active users. |
| 5 | Total sessions | Shows the total number of sessions, the average page views per session, and the average session duration. Select any visualization in this section to view the sessions trend analysis. |
| 6 | Top pages | List of pages with the most views and most sessions. Select any entry in the list to dive into the views and related information. |
Note:
- Counters in the Usage Insights application contain aggregated user numbers.
- If a country’s tracking consent policy is set to Disabled, user metrics are not tracked.