New Benchmarks Dashboard
The Benchmarks dashboard displays KPI data, performance trends, and indicator scorecards.
The Benchmarks KPI dashboard view, which shows all KPIs, is launched in Service Portal.
The dashboard features include the following: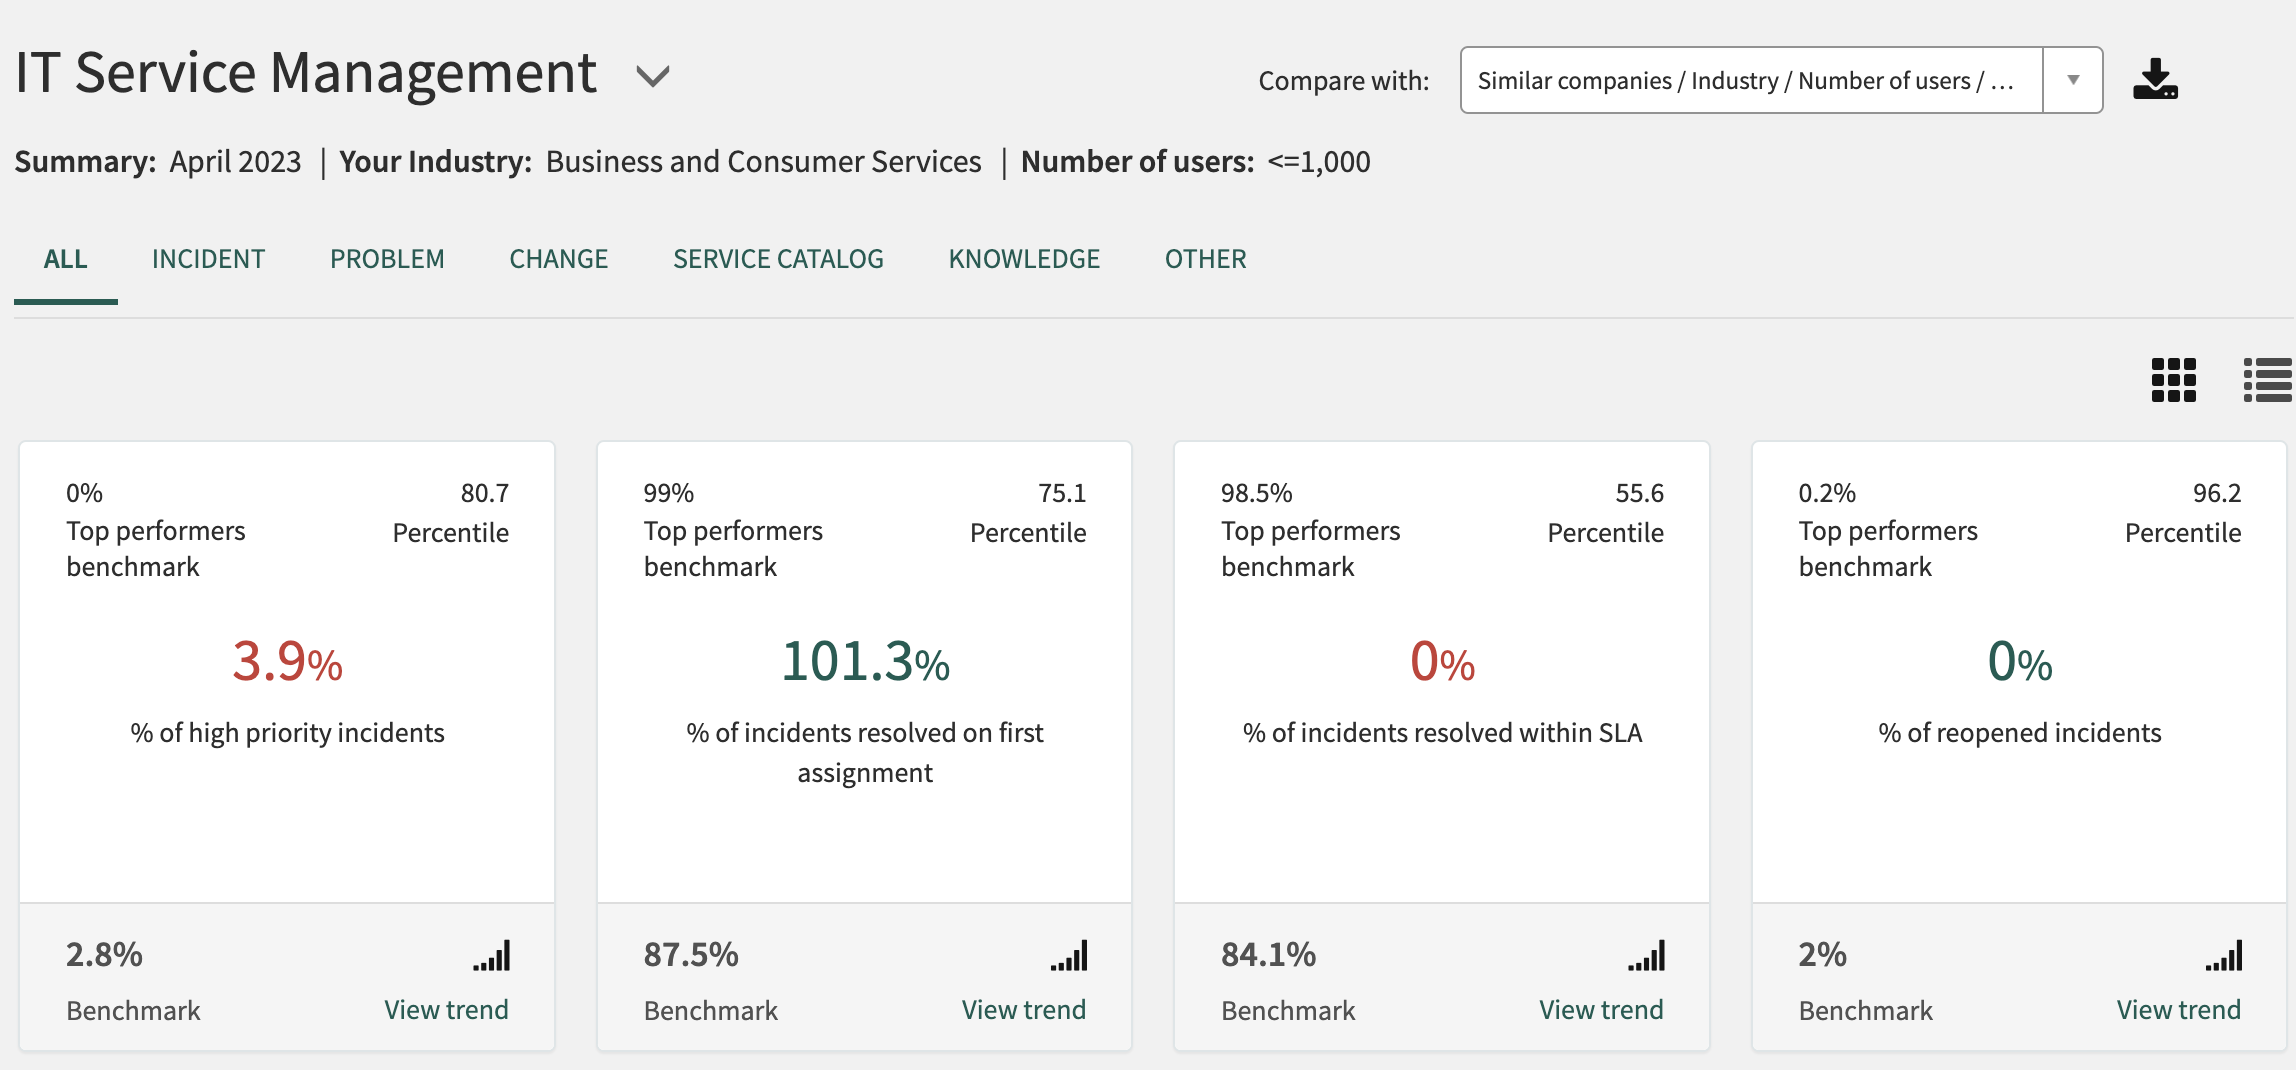
- KPIs are shown in either the list or card view.
- Downloadable reports of the KPI list are available in PDF format.
- Data is filtered by type of industry, number of users, Managed Service Providers (MSPs), or geographic region (the filter is retained when switching between the KPI view and trend view).Note:Only MSPs can view the global MSP aggregate score data.
- The performance against the global data is shown with a thumbs up or thumbs down representation.
- 6 months of historical KPI data can be viewed.
- Time values can be displayed in hours or days using the sn_bm_client.dashboard_display_unit system property.
Note:
The new Benchmarks dashboard is available from the ServiceNow store.
Percentile rank
The exact standing of the KPI for your company within your participating peer group is indicated by percentile rank. A KPI percentile rank of 90% indicates that your instance standing for that KPI is greater than 90% of the instances participating in that group.
| KPI | Direction (Percentile rank goal) |
|
|---|---|---|
| Minimize | Maximize | |
| Incident | ||
| % of high priority incidents resolved |  |
 |
| % of incidents resolved on first assignment | |
|
| % of incidents resolved within SLA | |
|
| % of reopened incidents | |
|
| Average time to resolve a high priority incident | |
|
| Average time to resolve an incident | |
|
| Number of incidents created per user | |
|
| Problem | ||
| % of high priority problems | |
|
| % of incidents resolved by problem | |
|
| Average time to close a problem | |
|
| Change | ||
| % of emergency changes | |
|
| % of failed changes | |
|
| Average time to close a change | |
|
| Service Catalog | ||
| % of closed requests with breached SLAs | |
|
| Average time to fulfill a request | |
|
| Number of requests created per user | |
|
| Knowledge | ||
| % of incidents resolved using KB articles | |
|
| Number of knowledge article views per user | |
|
| ITSM Virtual Agent | ||
| % call deflection | |
|
| % of incidents auto-resolved | |
|
| Other | ||
| Average customer satisfaction | |
|
| Number of requesters per fulfiller | |
|
| CMDB | ||
| % of duplicate CIs | |
|
| % of non-compliant CIs | |
|
| % of stale CIs | |
|
| Security Incident Response | ||
| % of critical and high priority security incidents | |
|
| Vulnerability Response | ||
| Average critical vulnerability age | |
|
| Average vulnerability age | |
|
| Virtual Agent | ||
| % of users using Virtual Agent | |
|
| % conversation handed over to a live agent | |
|
| Virtual Agent CSAT score | |
|
| Success Dashboard | ||
| Self-solved % | |
|
| Call deflection % | |
|
| Structured tickets % | |
|
| Customer satisfaction survey scores | |
|
| MTTR – Average mean time to resolution | |
|
| Breached SLA % | |
|
| First assignment resolution | |
|
| % Automated resolutions | |
|
| % KB - Self-solved (count) | |
|
| % VA - Self-solved (count) | |
|
| % Call deflection when self-solved (count) | |
|
| % VA ticket submissions (count) | |
|
| % Catalog ticket submissions (count) | |
|